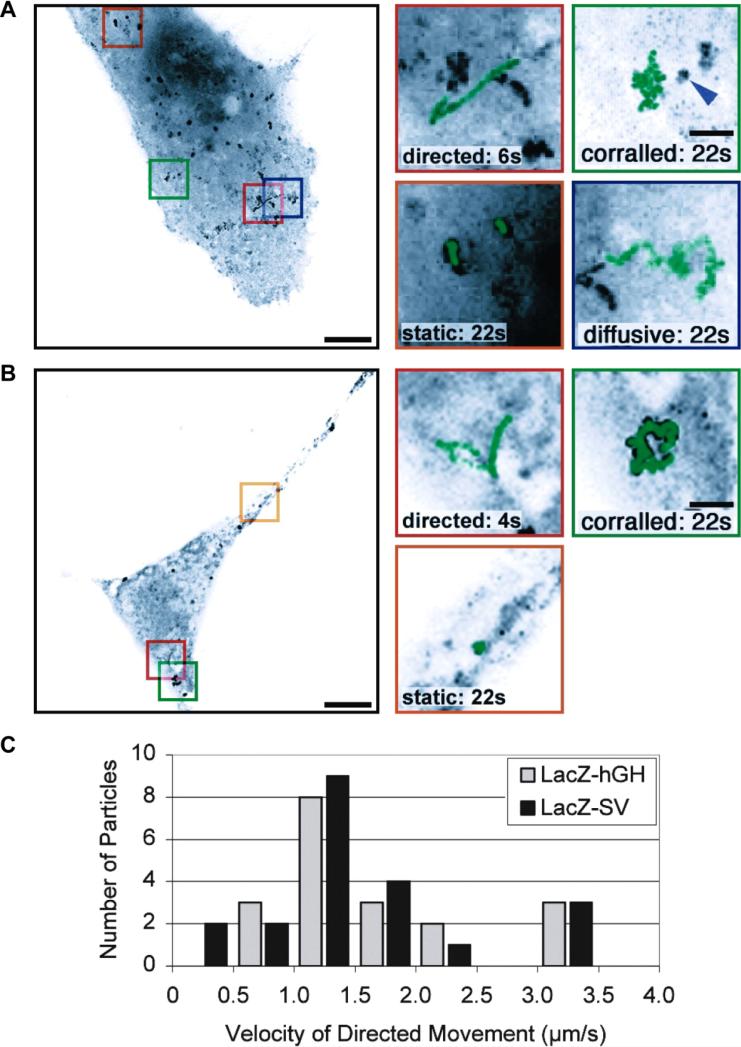
Figure 13. Cytoplasmic mRNP dynamics.
(A) Movements of an MCP-FP labeled LacZ-hGH mRNA. Overlay of a 200-frame video (left image). The scale bar located in the bottom right corner represents 10 μm. Magnifications of select regions of the projection image are shown in the right images. The scale bar here represents 2 μm. Green lines represent the tracks the particles traverse. (B) Movements of an MCP-FP labeled Lacz-SV mRNA, imaged similar to panel A. (C) Distributions of LacZ-SV mRNP motions with and without a β-actin 3’-UTR. Reprinted with permission from ref. 233. Copyright 2003 Elsevier.

