. 2014 Jan 16;3(1):A0025. doi: 10.5702/massspectrometry.A0025

Fig. 4. Correlation between the concentrations of S-777469 in the calibration standards and the signal intensity ratios of S-777469/S-777469-d10 measured by MALDI-IMS, indicated by open circles. The filled symbols indicate the tissue samples of the kidney (blue) or liver (green) of the mouse No. 1 (squares) or No. 2 (circles), plotted with the concentration of S-777469 determined by LC-MS/MS on the horizontal axis and the signal intensity ratio of S-777469/S-777469-d10 measured by MALDI-IMS on the vertical axis.
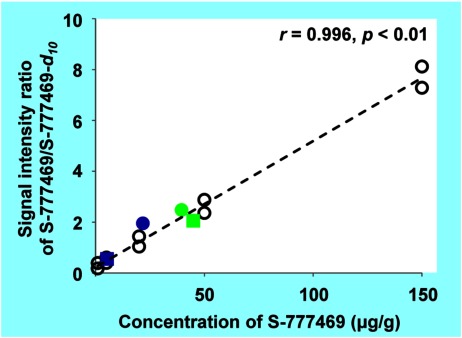
Fig. 4. Correlation between the concentrations of S-777469 in the calibration standards and the signal intensity ratios of S-777469/S-777469-d10 measured by MALDI-IMS, indicated by open circles. The filled symbols indicate the tissue samples of the kidney (blue) or liver (green) of the mouse No. 1 (squares) or No. 2 (circles), plotted with the concentration of S-777469 determined by LC-MS/MS on the horizontal axis and the signal intensity ratio of S-777469/S-777469-d10 measured by MALDI-IMS on the vertical axis.