
Figure 4.
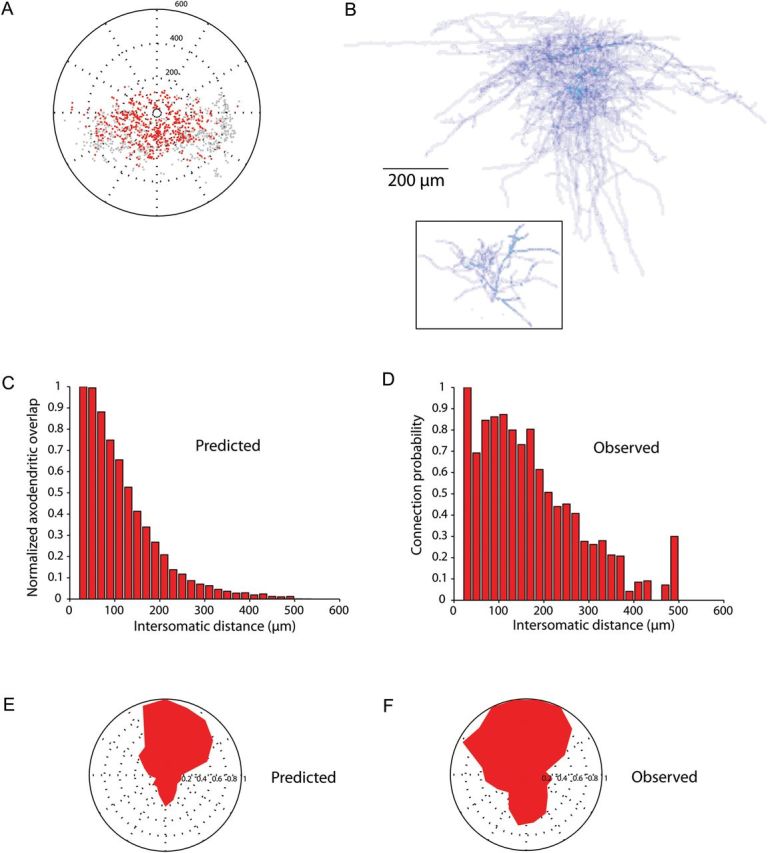
Axo-dendritic overlap can predict the spatial patterns of SOM connectivity. (A) Position of the connected (red) and unconnected (gray) SOM interneurons plotted relative to the recorded PC (center). (B) Average density of 5 frontal cortex layer 2/3 SOM interneuron axons (top) and 4 frontal cortex layer 2/3 PC apical dendrites (black box) was multiplied to produce a measure of axo-dendritic overlap between axons of SOM interneurons and apical dendrites of PCs. (C) The predicted probability of connection versus intersomatic distance between the SOM interneuron and the PC based on axo-dendritic overlap. (D) Observed probability of connection versus intersomatic distance, calculated as the number of connected interneurons out of the total number of connected and unconnected interneurons (presented in Fino and Yuste (2011) and slightly different than the expected probability since the calculated probability included false positives in the denominator). (E–F) Predicted and observed probabilities of connection versus angle between the SOM interneuron and the PC (center).