
Figure 6.
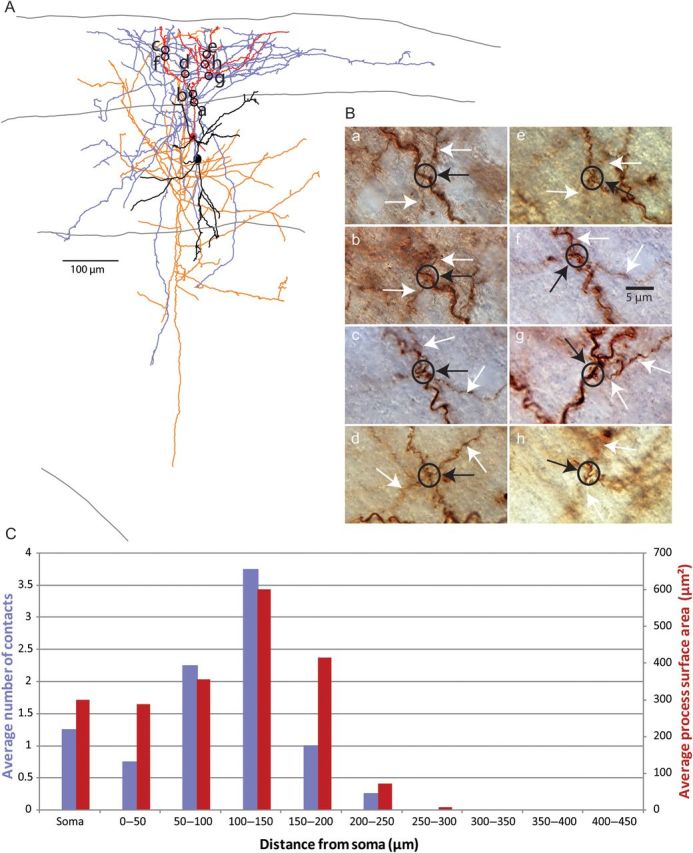
Position of synaptic connections from SOM interneurons to PCs. (A) Anatomical reconstruction of a SOM-PC pair with location of contacts from SOM axon to PC dendrite. PC soma and dendrites in red, axon in orange. SOM cell soma and dendrites in black, axon in blue. Pia, layer 2/3 and layer 4 boundaries, and white matter drawn. (B) Photomicrographs of contacts from reconstruction (black circle surrounds contacts, white arrow indicates SOM cell axon, black arrow points to connection, label corresponds to location on anatomical reconstruction). (C) Average number of connections (purple bars) and average process surface area in hundreds of µm2 (red bars) versus distance from PC soma. First bin includes only the soma. Also note that the small difference in the distribution of layer 2/3 PC dendritic surface area compared with Figure 5C is due to the random selection of PCs further from the pial surface here.