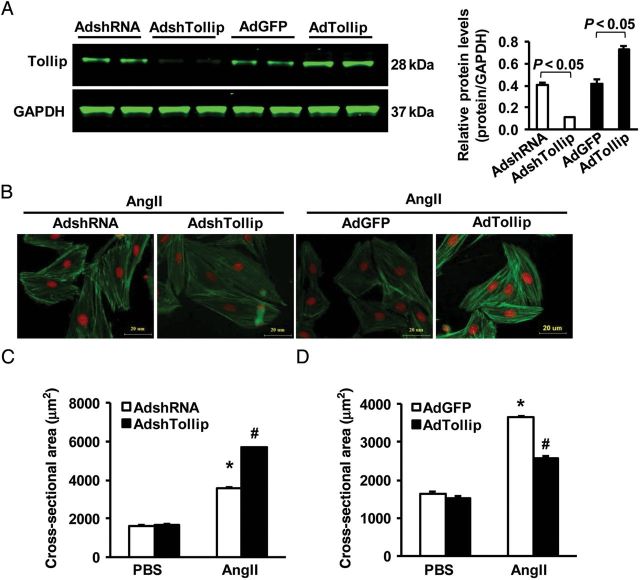
Figure 2.
Effects of Tollip on myocyte hypertrophy in vitro. (A) The protein expression level of Tollip after infection with AdshTollip or AdTollip (n = 4). (B) Representative images of NRCMs infected with AdshTollip or AdTollip in response to Ang II. (C and D) Quantitative results of the cell surface area in the indicated groups. n = 4, *P < 0.05 vs. Ad-shRNA or Ad-GFP. More than 100 cells for each group were analysed.

