
Figure 4.
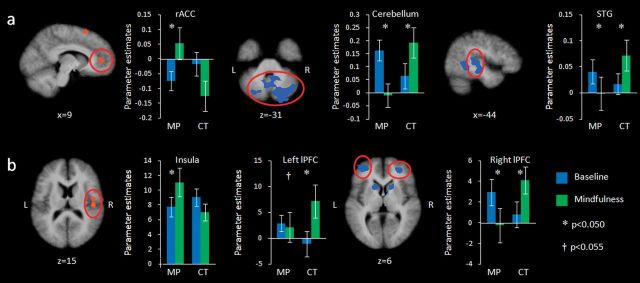
Activation during the baseline (blue) and mindfulness (green) condition for mindfulness practitioners (MP) and controls (CT), (a) while anticipating electric shocks and (b) while receiving electric shocks. Maps are the result of a whole-brain random effects analysis, are cluster level corrected for multiple comparisons at P < 0.05 (voxel threshold P < 0.05, extent 41 for stimulation and 44 for anticipation contrasts), and represent the interaction between group (mindfulness practitioners vs. controls) and condition (mindfulness vs. baseline). Red: activation greater in mindfulness practitioners; blue: activation greater in controls. Bars represent parameter estimates, error bars are standard errors of the mean. STG = Superior temporal gyrus (BA22).