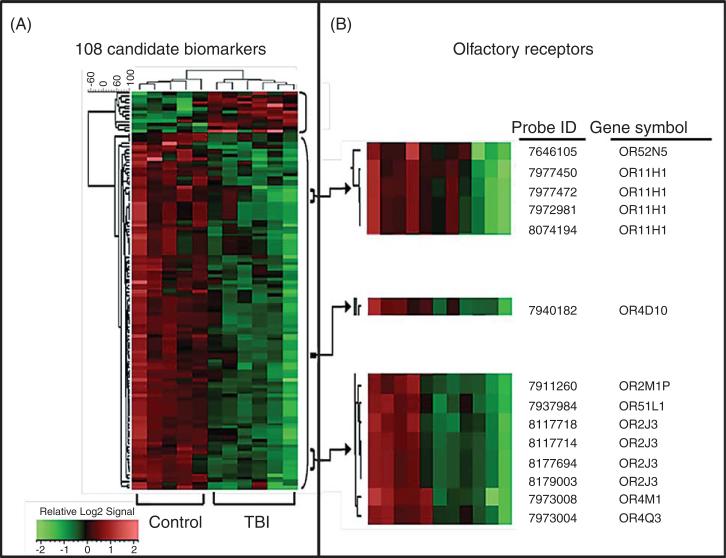
Fig. 1.
Development of blood biological indices (biomarkers) capable of correctly segregating TBI and control cases. Gene expression profile analysis of PBMC specimens from TBI and 5 age-, gender-, and education-matched control cases using a microarray platform (Affymetrix) led to the identification of a panel of 102 candidate biomarker genes. A) The 108 differentially-regulated genes identified were subjected to unsupervised hierarchical clustering analysis using the UPGMA algorithm with cosine correlation as the similarity metric. Results are presented as a heat map (left panel) demonstrating that the content of the 108 biomarker panel is able to correctly segregate TBI from control cases. B) 7 ORs and one OR pseudogene that are down-regulated in PBMC of TBI cases.

