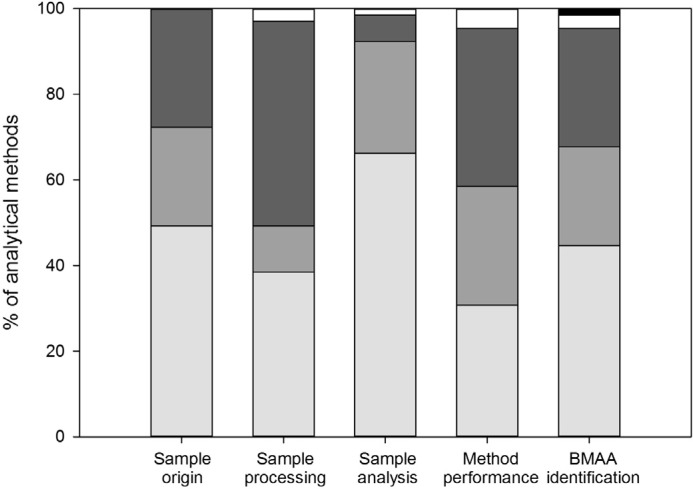
Figure 2.
Quality of reporting for analytical methods. Bars indicate: (nearly) correct and complete (light grey), incomplete or with errors (medium grey) and absent or with major errors (dark grey). Data that have been published in previous method descriptions are shown in white, and ‘not applicable’ is shown in black. Results are summarized from Appendix information 7.

