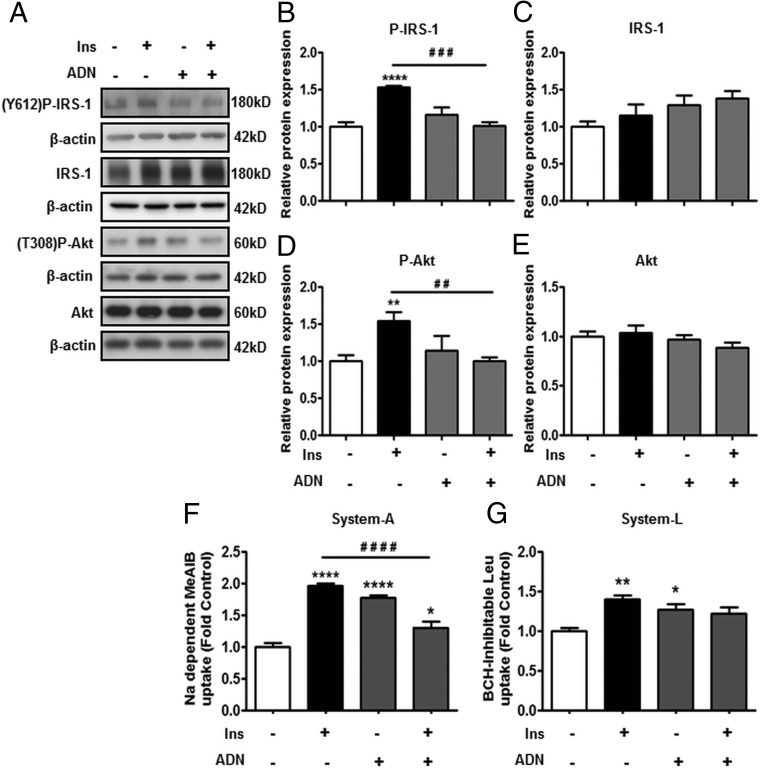
Figure 1.
ADN inhibits insulin (Ins) signaling and insulin-stimulated amino acid transport. PHT cells were incubated with Ins (5.8 ng/mL), ADN (5 μg/mL), or Ins (5.8 ng/mL) + ADN (5 μg/mL), and protein lysates were examined by immunoblotting or systems A and L amino acid transport activity was measured. A, Representative immunoblots of P-IRS-1 (Y612), IRS-1, P-Akt (T308), Akt, and β-actin. Histograms illustrate relative protein expression of (B) phosphorylated IRS-1 (Y612), (C) IRS-1, (D) phosphorylated Akt (T308), and (E) Akt. F, system A activity was determined as sodium-dependent methyl-aminoisobutyric acid uptake and (G) system L activity by BCH-inhibitable leucine uptake. Data represent fold change from vehicle control (PBS, 0.1% vol/vol). Mean + SEM, n = 6 (cell signaling), n = 4 (amino acid transport); one-way ANOVA; *, P < .05; **, P < .01; ****, P < .0001 vs Cnt; or # #, P < .01; # # #, P < .001; # # # #, P < .0001 vs Ins. Ins, insulin; Y612, tyrosine 612; T308, threonine 308.

