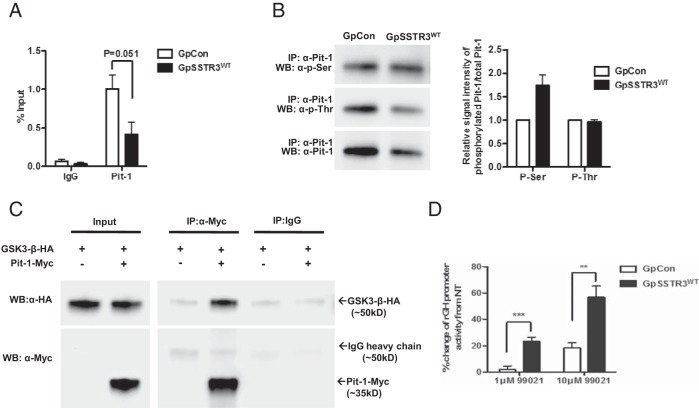
Figure 6.
Characterization of Pit-1 as a GSK3-β substrate. A, Quantitative ChIP analysis of Pit-1 occupancy on the rGH promoter (n = 4). B, Representative Western blot of basal serine and threonine phosphorylation state of Pit-1 in stable transfectants by immunoprecipitation including signal intensity quantification by densitometry analysis normalized to total Pit-1 levels. IP, immunoprecipitated; WB, Western blot (n = 3). C, Nuclear coimmunoprecipitation of cotransfected Myc-tagged Pit-1 and HA-tagged GSK3-β. GSK3-β fusion protein runs at 50-kDa and overlaps with IgG heavy chain. A representative blot is depicted. D, Effect of GSK3-β inhibition on rGH promoter activity in GpSSTR3WT and GpCon expressed as percent change from nontreated cells (n = 5). 99021, CHIR99021 (BioVision). **, P < .01; ***, P < .001.

