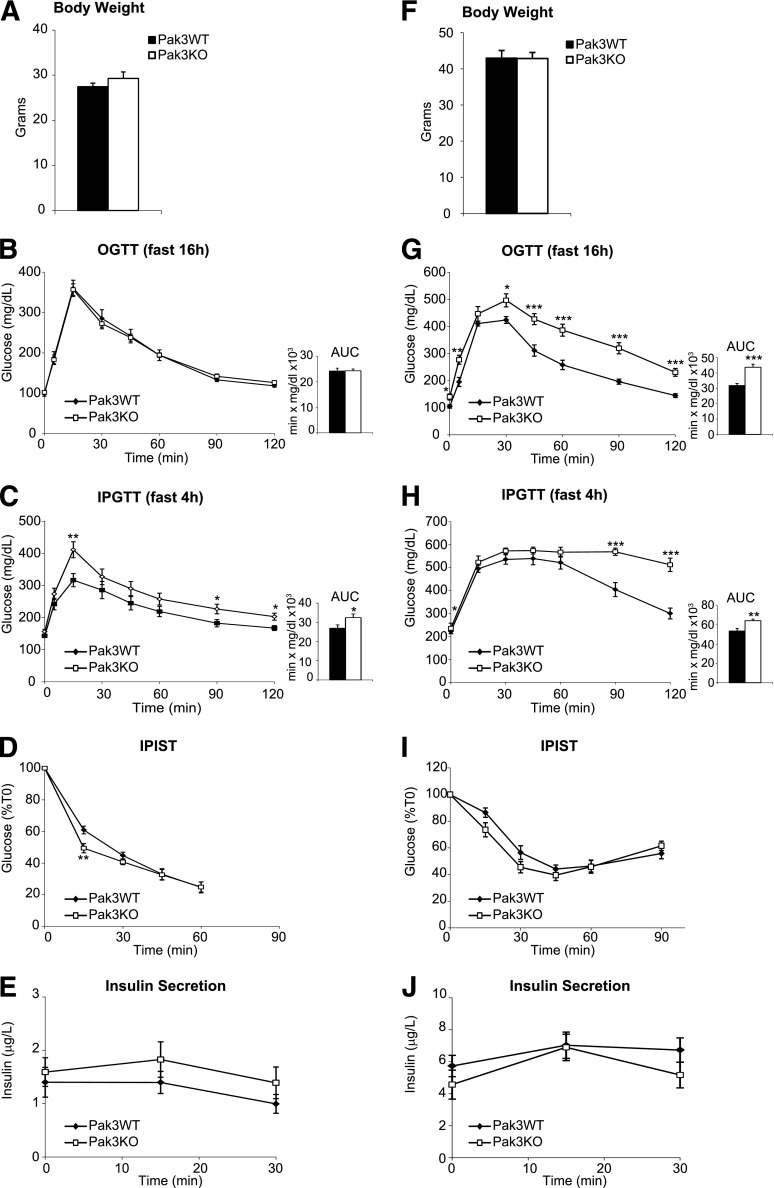
Figure 7.
Impaired glucose homeostasis in Pak3-deficient mice. Exploration of glucose metabolism in adult Pak3 KO (n = 13) and Pak3 WT (n = 13) males under normal diet (A–E) or HFD (F–J). Body weight measure (A and F), OGTT after 16-h fasting (B and G), IPGTT after 4-h fasting (C and H), intraperitoneal insulin sensitivity test (IPIST) after 6-h fasting (D and I), and blood insulin levels during the IPGTT (E and J). Data are represented as mean ± SEM. *P < 0.05; **P < 0.01; ***P < 0.001.

