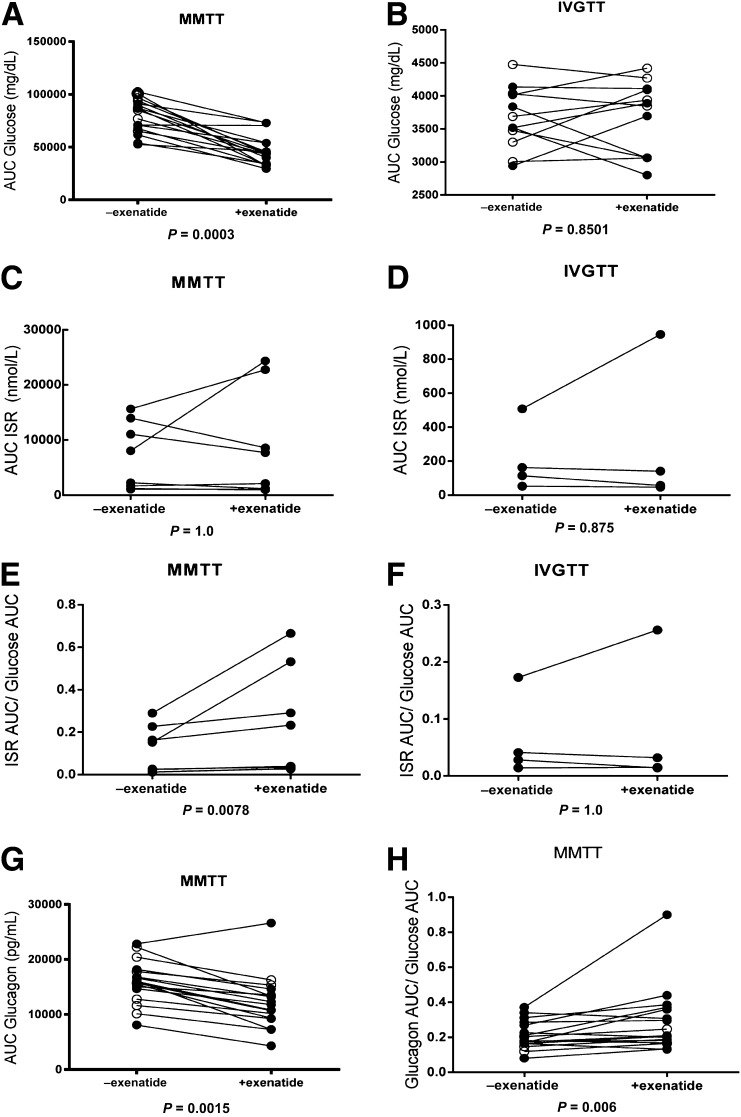
Figure 2.
Changes in hormonal responses during MMTT and IVGTT with exenatide.A: AUC for glucose (in milligrams per deciliter) during an MMTT without and with administration of exenatide, 5 µg s.c. (P = 0.0003). B: AUC for glucose (in milligrams per deciliter) during IVGTT without and with exenatide (P = 0.8501). C–F: Only patients with detectable C-peptide levels are shown. C: AUC for ISR (in nanomoles per liter) during MMTT without and with subcutaneous injection of exenatide (P = 1.0). D: AUC for ISR during an IVGTT (P = 0.875). E: AUC ISR/AUC glucose during MMTT with and without exenatide (P = 0.0078). F: ISR AUC/glucose AUC at the time of IVGTT with and without pretreatment with exenatide (P = 1.0). G: AUC for glucagon (in picograms per milliliter) during MMTT with and without administration of exenatide (P = 0.0015) in all subjects. H: AUC of the glucagon/glucose ratio in all patients during MMTT, which shows a significant increase with exenatide (P = 0.006). Open circles (○) indicate C-peptide–negative patients, and closed circles (●) indicate C-peptide–positive patients. +, with; −, without.

