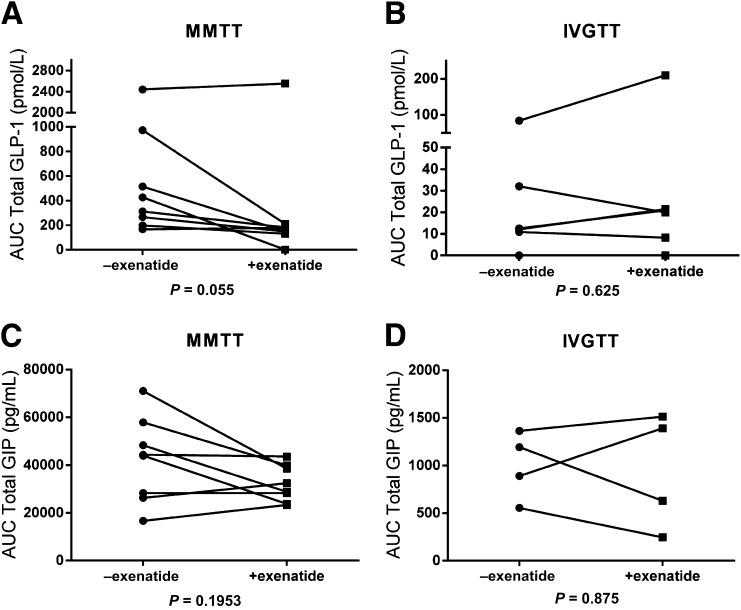
Figure 3.
Changes in incretins with exenatide. A: AUC for GLP-1 during MMTT without exenatide 662.6 ± 270 pmol/L vs. with exenatide 444.2 ± 302.1 pmol/L in eight subjects (P = 0.055). B: AUC for GLP-1 during IVGTT (without exenatide 25.28 ± 12.48 pmol/L vs. with exenatide 46.76 ± 32.83 pmol/L) in six subjects (P = 0.625). C: AUC for GIP during MMTT without and with exenatide in eight subjects. D: AUC for GIP (in picograms per milliliter) during IVGTT (P = 0.875). +, with; −, without.

