
Figure 3. Impulse response of the MRR-based PAM system.
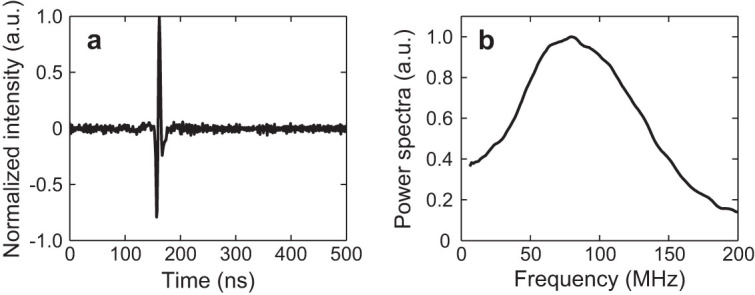
(a) Temporal profile of the impulse response. (b) Spectral profile of the impulse response after a 10-point moving averaging.
Official websites use .gov
A
.gov website belongs to an official
government organization in the United States.
Secure .gov websites use HTTPS
A lock (
) or https:// means you've safely
connected to the .gov website. Share sensitive
information only on official, secure websites.
(a) Temporal profile of the impulse response. (b) Spectral profile of the impulse response after a 10-point moving averaging.