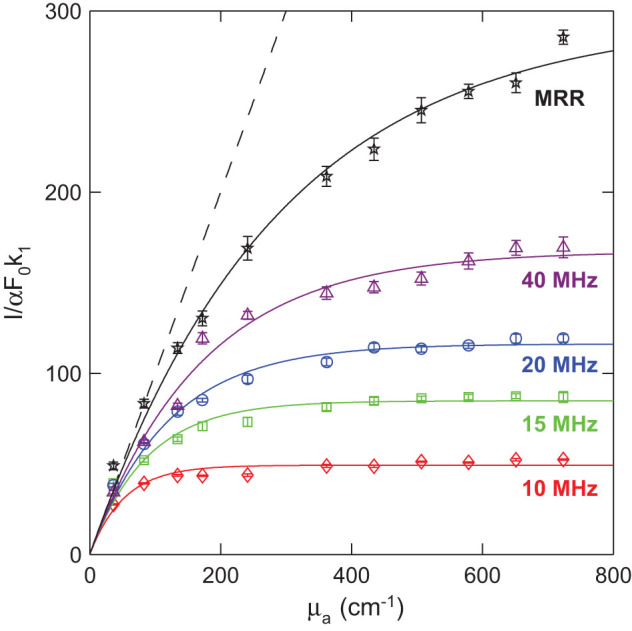
Figure 4. Comparison of PA saturation limits of the MRR ultrasonic detector (black star) and four commercial piezoelectric transducers.

The center frequencies of the piezoelectric transducers are 10 MHz (red diamond), 15 MHz (green square), 20 MHz (blue circle), and 40 MHz (purple triangle). The solid lines are respectively fitted curves from their corresponding experimental data. The black dash line is the ideal linear PA response from the theoretical model with no frequency cutoff. The saturation limits for 10-MHz, 15- MHz, 20- MHz and 40-MHz transducers are 58 cm−1, 91 cm−1, 125 cm−1, and 173 cm−1, respectively. The saturation limit of MRR is higher than 287 cm−1, which is about two-fold improved from the 40-MHz piezoelectric detector.
