
Figure 5. Angular dependence of the frequency response of the MRR ultrasonic detector.
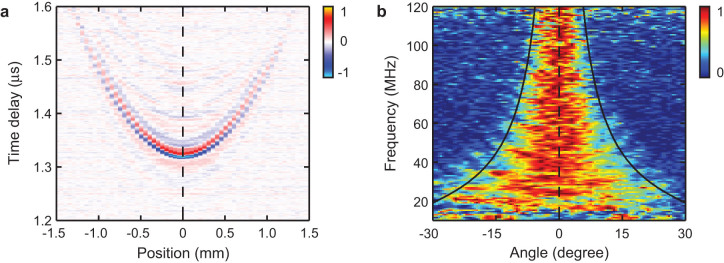
(a) Time-resolved PA signals with respective to the positions of the PA point source. (b) Normalized angular dependence of frequency response obtained by Fourier transfer of the PA signals in panel (a). The black lines are the FWHM angular-dependent sensitivity calculated from the theoretical model.