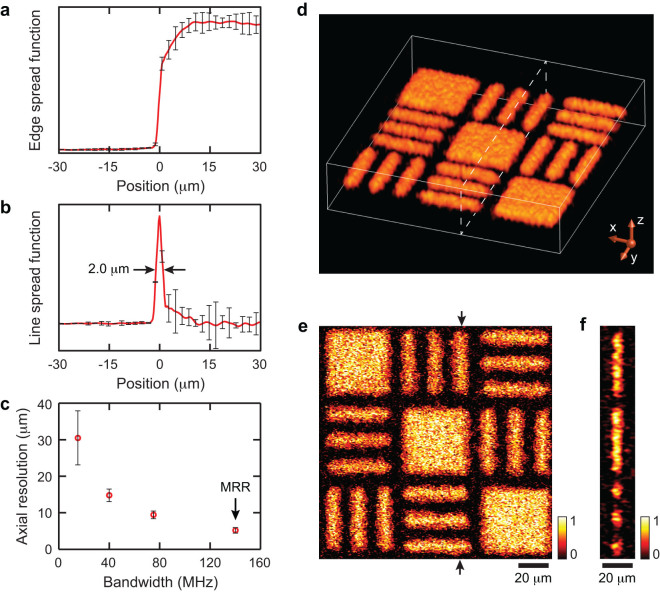
Figure 6. The lateral and axial resolutions of the MRR-based PAM system and volumetric imaging of a carbon-black thin-film target.
(a) Experimentally obtained ESF. (b) Calculated LSF from the ESF to quantify lateral resolution. Error-bars were calculated from 128 data sets. The lateral resolution is estimated to be 2.0 μm. (c) Axial resolutions of three commercial piezoelectric transducers with different center frequencies: 15 MHz (P15), 40 MHz (P40), and 75 MHz (P75), and the MRR ultrasonic detector. Error-bars were calculated from 20 measurements. (d) Volumetric visualization of the imaged target. (e) The MAP image of the target along the x-y plane. (f) A cross-sectional image of the target at the position highlighted by the dashed box in the panel (d) and the arrows in the panel (e).

