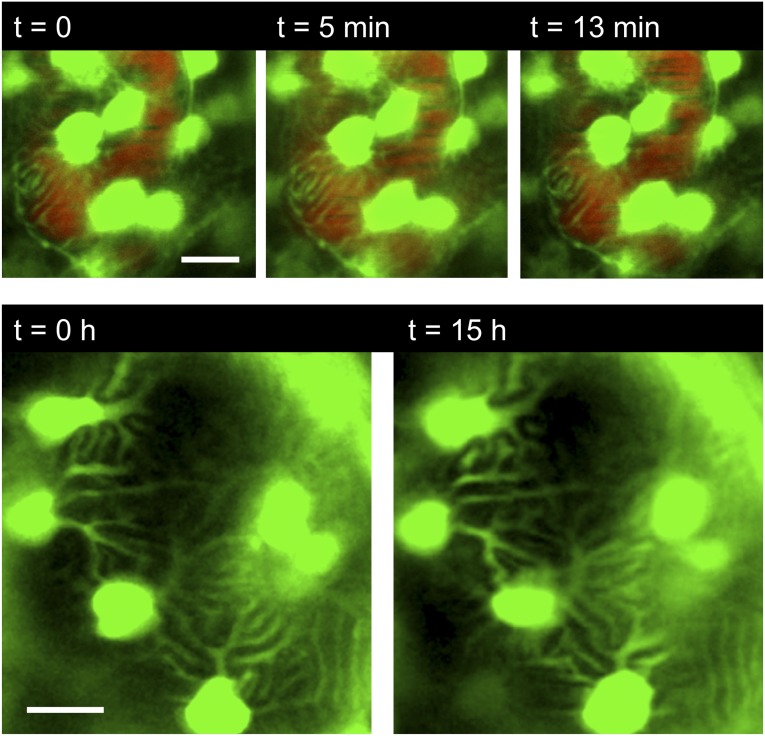
Figure 2.
Podocyte processes can be visualized in vivo over time. Upper panel: ET larva injected with Qdots (red) for visualization of the capillaries in the pronephros. Short-time series showing the processes of podocytes attached to glomerular capillaries (images were taken every 60 seconds). No dynamics of the processes were observed. (Bottom) ET larva recorded for 15 hours. Images were taken every 30 minutes. No notable changes of the position of the primary and secondary processes were observed. Scale bars: 10 µm.

