Figure 3.
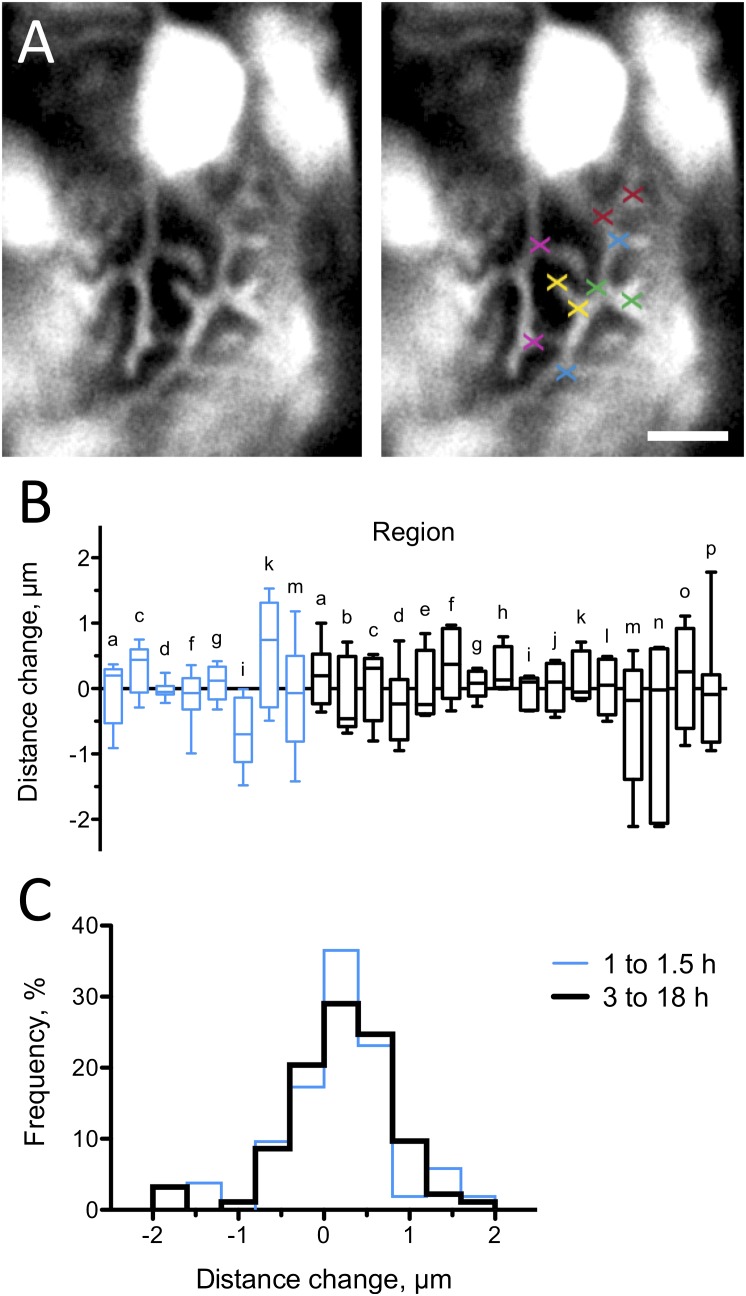
Podocyte processes are stationary over time. Motility of podocyte processes was assessed by measuring several distances between characteristic branching points per region at two time points. (A) As an example, five different distances were measured in one region and are indicated by crosses of the same color. (B) Box plot of the distance changes in 16 regions (regions a–p) in 11 larvae after a mean time of 6.1 hours (black boxes; n=93 measured distances). Distance changes in eight regions were measured additionally after a mean time of 1.2 hours (blue boxes; n=49 measured distances). None of the regions showed a significant positive or negative mean change in distances, corresponding to expansion or contraction of processes, respectively. (C) The distribution of distance changes after 3–18 hours is similar to that after 1–1.5 hours, indicating that the motility of podocyte processes over several hours is below our experimental detection limit of about 1.5 µm. Scale bar: 10 µm.

