Figure 6.
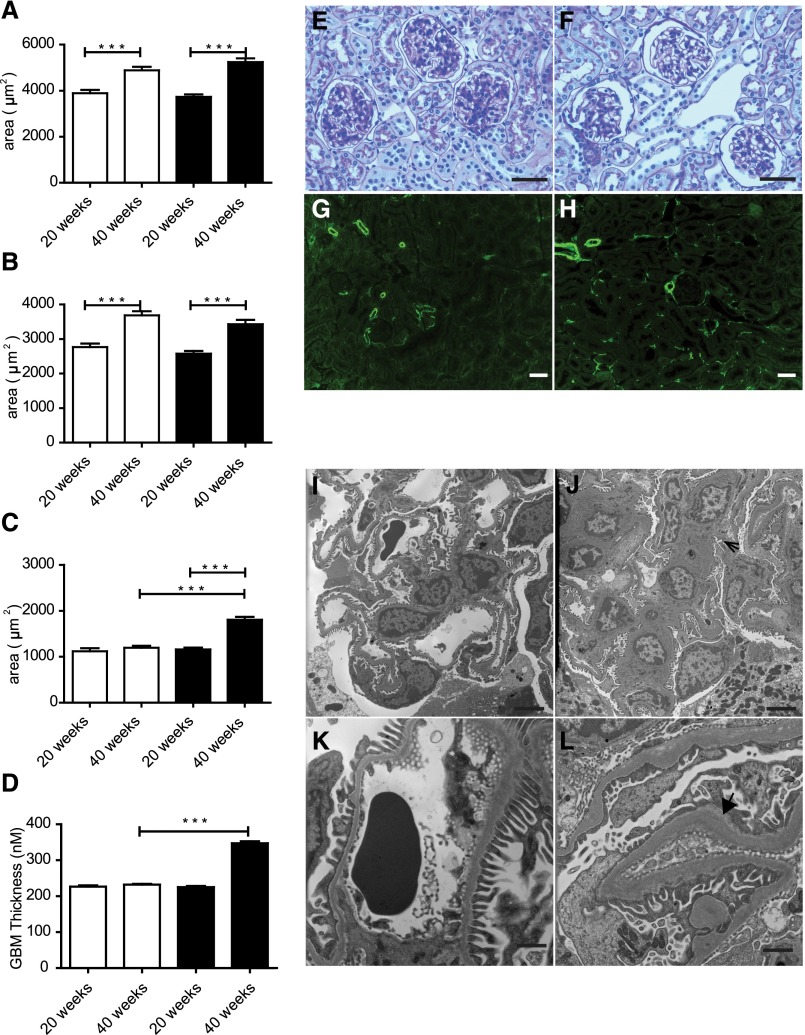
Nox5pod+ mice display GBM thickening, foot process effacement, and progressive interstitial fibrosis. (A) Total glomerular area for non-tg (white columns) and Nox5pod+ (black columns) littermates at ages 20 and 40 weeks (n=3). ***P<0.001. (B) Glomerular tuft area for non-tg (white columns) and Nox5pod+ (black columns) littermates at ages 20 and 40 weeks (n=3). ***P<0.001. (C) Bowmann’s space area for non-tg (white columns) and Nox5pod+ (black columns) calculated by subtracting (B) glomerular tuft area from (A) total glomerular area (n=3). ***P<0.001. (D) GBM thickness for non-tg (white columns) and Nox5pod+ (black columns). ***P<0.001. PAS staining on paraffin-embedded kidney sections from (E) non-tg mice and (F) Nox5pod+ littermates at 40 weeks of age. Scale bar, 100 μm. α-Smooth muscle actin staining (green) on paraffin-embedded kidney sections from (G) non-tg mice and (H) Nox5pod+ littermates at 40 weeks of age. Scale bar, 100 μm. Electron micrographs showing glomerular structure in (I and K) non-tg and (J and L) Nox5pod+ littermates at 40 weeks of age. Scale bar, 4 μm in I and J; 1 μm in K and L. Arrow in J indicates mesangial expansion. Arrowhead in L highlights extensive GBM thickening.

