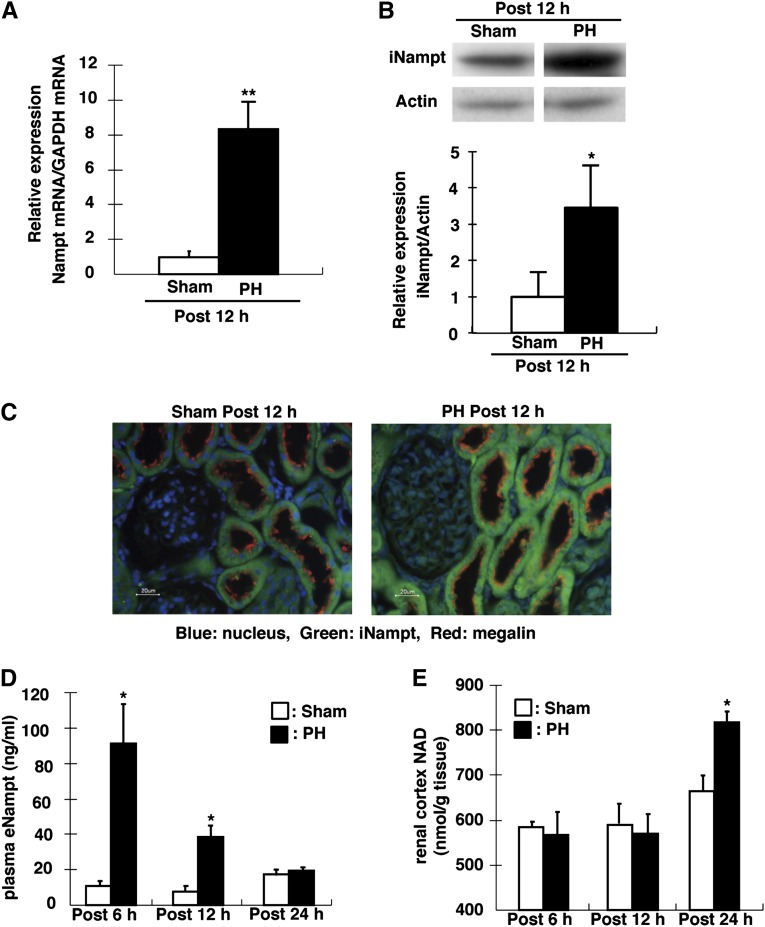
Figure 4.
Expression of iNampt in proximal tubules and serum eNampt in PH rats. (A) Nampt mRNA levels in the kidney of sham and PH rats are assessed by quantitative PCR. GAPDH is used as the internal control. The relative intensity of Nampt expression from the kidney of sham rats is defined as 1.0. (B) iNampt protein levels in the kidney of sham and PH rats are assessed by Western blotting analysis. Each lane is loaded with 20 µg of total lysate. Actin is used an internal control. Expression levels in sham rats are defined as 1.0. (C) Nampt localization in the kidney cortex is analyzed in the sham and PH rats. Nampt (green) is observed in cytosol of proximal tubules, and megalin (red) is expressed in BBM of proximal tubules. DAPI (blue) is used to stain the nucleus. (D) Serum eNampt is measured at 6, 12, and 24 hours after PH. The open column shows sham rats, whereas the filled closed column shows PH rats. (E) Total NAD of the kidney cortex is measured at 6, 12, and 24 hours after PH. The open column shows sham rats, whereas the filled column shows PH rats. Data are presented as the mean±SEM (n=4–6/group). *P<0.05; **P<0.01. DAPI, 4′,6-diamidino-2-phenylindole; GAPDH, glyceraldehyde 3-phosphate dehydrogenase.

