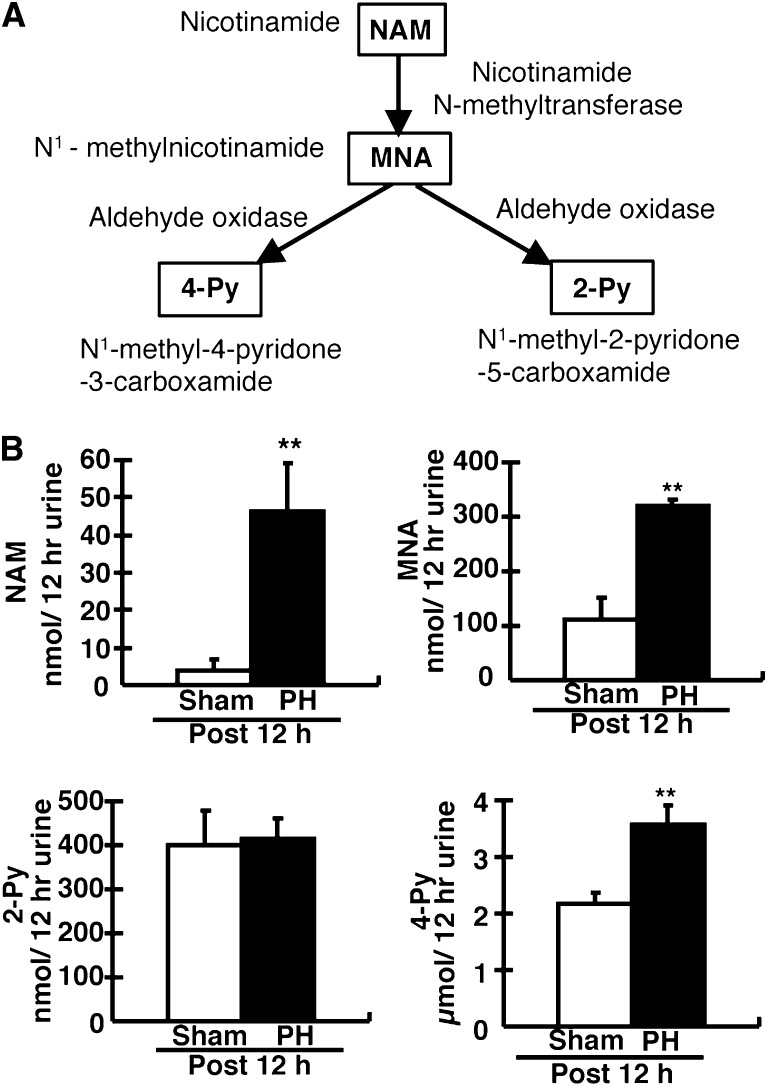
Figure 5.
Analysis of NAM and its catabolites in PH rats. (A) A schematic of the mammalian NAM catabolic pathway in liver. Excess NAM is converted into MNA, 2-Py, and 4-Py. These catabolites are excreted into the urine. (B) The values represent the total amount of NAM and its catabolites in urine for 12 hours after PH. Male 9- to 10-week-old rats are used. Data are presented as the mean±SEM (n=5–7/group). **P<0.01.

