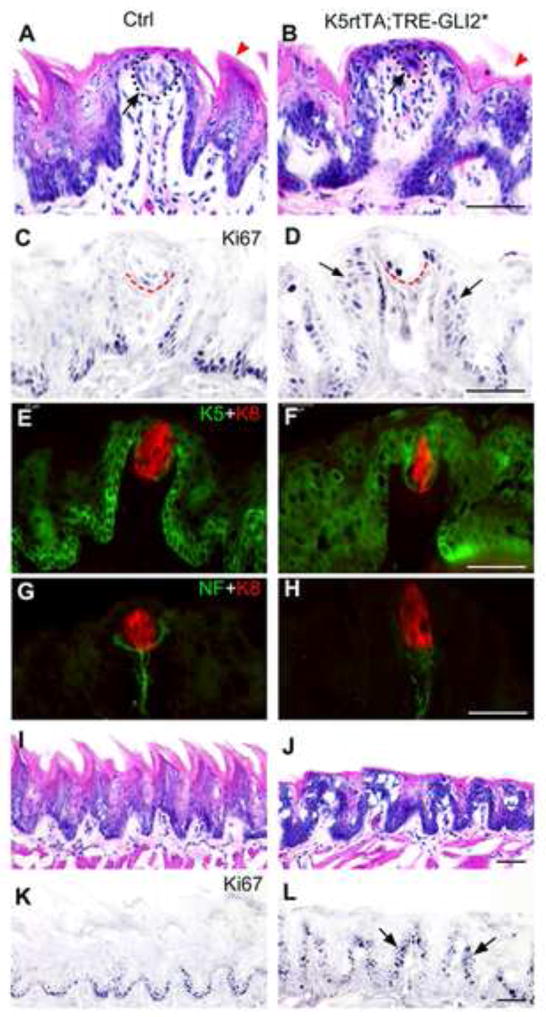
Figure 8. With Gli2* activation, fungiform and filiform papilla epithelium is hyperproliferative, remaining taste buds are thin, but K8-positive and innervated.
A, B. Hematoxylin and eosin sections illustrate that compared to the Control (Ctrl) papilla, fungiform papillae in the GLI2* tongue (K5rtTA;TRE-GLI2*) are misshapen. Clusters of cells are observed in some papillae that presumably represent thin, taste bud remnants (arrow points to dotted cell outline in B; compare to A). Red arrowheads in A and B point to filiform papillae. C, D. With Ki67 immunoreactions, cell proliferation is observed in suprabasal cell layers, where not seen normally, in the GLI2* tongue (arrows in D). A red outline indicates a taste bud (C) or cell cluster (D). E, F. K8 is used as a taste bud cell marker and demonstrates a much reduced set of taste bud cells in the GLI2* tongue. Also with K5, a basal cell cytokeratin, the suprabasal proliferation is obvious. G. H. Nerve fibers innervate the taste bud in Control and GLI2* tongues (neurofilament immunoreaction, NF). I, J. Hematoxylin and eosin stain, and K, L, Ki67 immunoreactions, demonstrate loss of spinous filiform papillae (J) and suprabasal proliferation in GLI2* tongue epithelium (arrows in L). Scale bars = 50 μm.

