Figure 3.

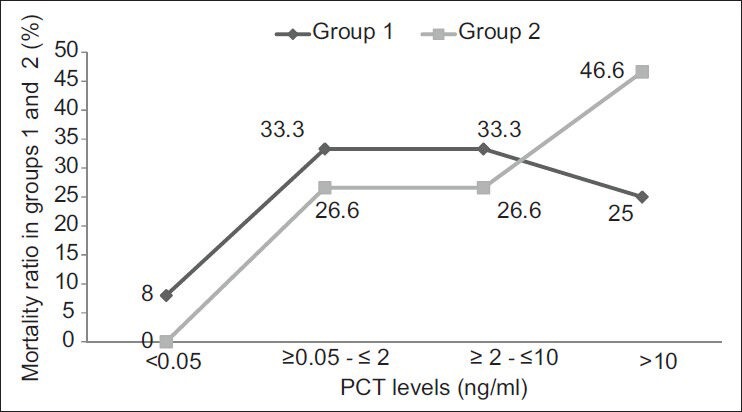
The mortality ratio between groups 1 and 2 in relation to the difference in PCT levels, which clearly shows that mortality rate is higher in the group with PCT > 10 ng/ml especially in group 2 patients

The mortality ratio between groups 1 and 2 in relation to the difference in PCT levels, which clearly shows that mortality rate is higher in the group with PCT > 10 ng/ml especially in group 2 patients