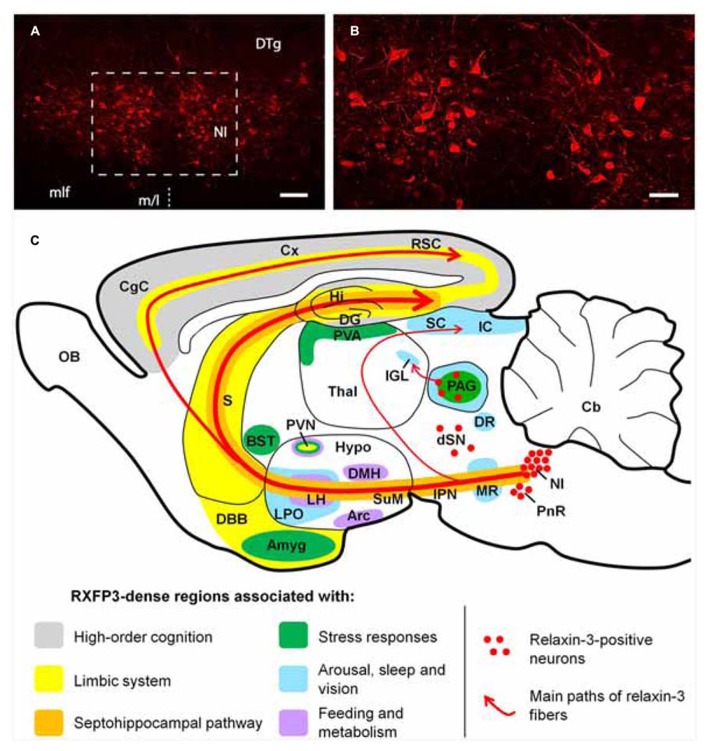
FIGURE 1.
(A,B) Low and high magnification micrographs of a coronal section through the mouse NI, displaying neurons positive for relaxin-3-like fluorescent immunoreactivity. The region displayed in (B) is outlined in (A). The location of the midline (m/l) is indicated with a dotted line. Anterior-posterior coordinates from bregma, -5.38 mm. Scale bars A, 100 μm; B, 250 μm. (C) Schematic parasagittal representation of the rodent brain, illustrating the ascending relaxin-3 system and the distribution of RXFP3 in regions grouped by function. Amyg, amygdala; Arc, arcuate nucleus; BST, bed nucleus of stria terminalis; Cb, cerebellum; CgC, cingulate cortex; Cx, cerebral cortex; DBB, diagonal band of Broca; DG, dentate gyrus; DMH, dorsomedial nucleus of hypothalamus; DR, dorsal raphé nucleus; dSN, region dorsal to the substantia nigra; DTg, dorsal tegmental nucleus; Hi, hippocampus; Hypo, hypothalamus; IC, inferior colliculus; IGL, intergeniculate leaflet; IPN, interpeduncular nucleus; LH, lateral hypothalamus; LPO, lateral preoptic area; MLF, medial longitudinal fasciculus; MR, median raphé; NI, nucleus incertus; OB, olfactory bulb; PAG, periaqueductal gray; PnR, pontine raphé; PVA, paraventricular thalamic area; PVN, paraventricular hypothalamic nucleus; RSC, retrosplenial cortex; S, septum; SC, super colliculus; SuM, supramammillary nucleus; Thal, thalamus.

