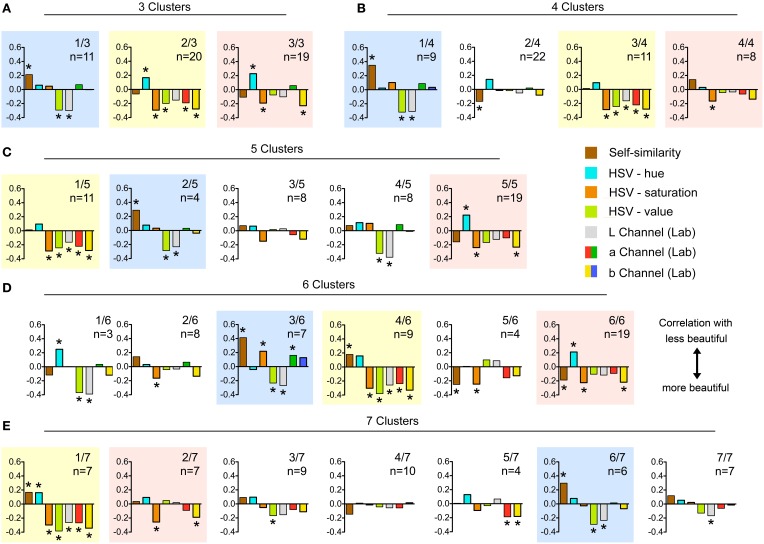
Figure 6.
Spearman coefficients for the correlations between image properties and beauty ratings. For the color coding of the different image properties, see the explanation on the right hand side of (C). (A–E) show the results for the different numbers of clusters (3–7 clusters, respectively). The colored backgrounds highlight clusters of similar preferences, independent of how many clusters (3–7) were formed. *Indicates significant correlations (p < 0.05 or lower).

