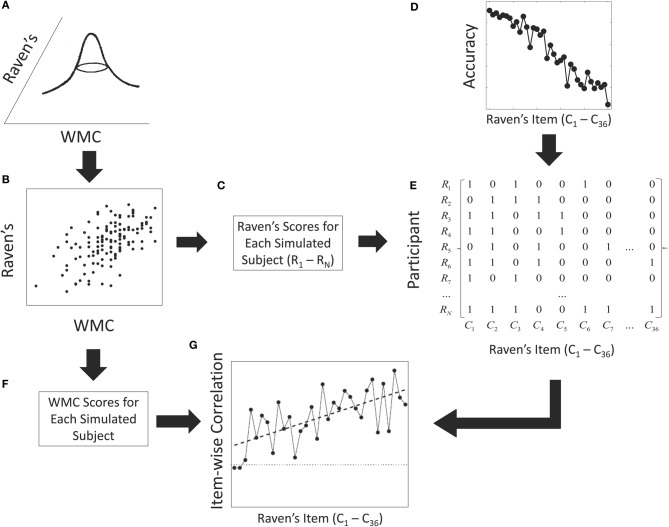
Figure 3.
Data generation process used in the simulation study. First, a pair of individual WMC and Raven's scores are sampled from a bivariate normal distribution (A). The sample shown in panel (B) is from the current behavioral study. The Raven's scores for each simulated subject (C) and the accuracy on each Raven's item (D) are used to constrain the generation of a simulated binary vector of correct and incorrect responses for each simulated subject. See text for details. The columns of the simulated binary matrix (E) are correlated with the overall WMC scores for each simulated subject (F) to produce an item-wise correlation function (G).

