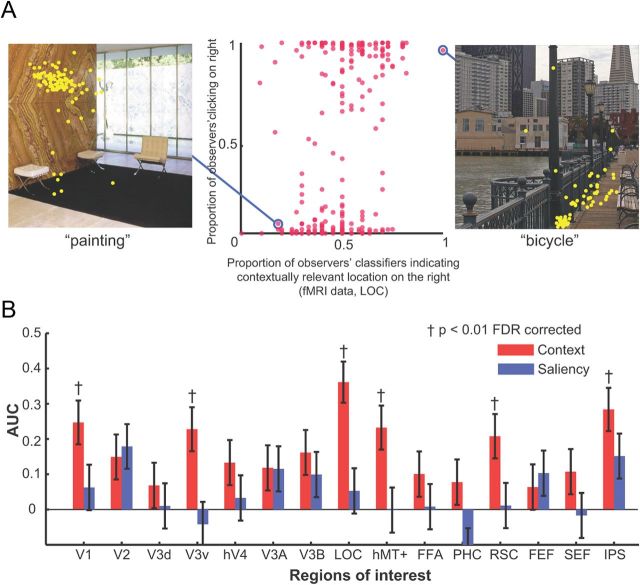
Figure 4.
A, Scatter plot showing the relationship between the proportion of observers' contextually relevant selections (n = 100) that fell into the right image hemifield and proportion of MVPA classifiers' AUC (area LOC) across 12 brains predicting that the contextual location was on the right side of the image. B, Correlations for all ROIs for the same analysis I (A) for all ROIs including results for the saliency control experiment. Areas V1, V3v, LOC, hMT+, RSC, and IPS show significantly above-chance correlations (p < 0.01; FDR corrected). Error bars indicate SEM. † indicates significance at p < 0.01; FDR corrected.

