
Fig. 3.
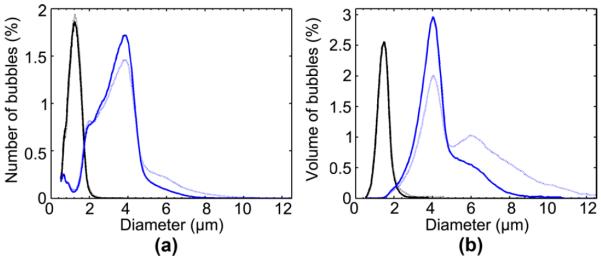
Size distributions of microbubbles are depicted as (a) number-weighted percent of the total concentration of bubbles and (b) volume-weighted percent of the total volume of bubbles. Distinct peaks at approximately 1–2 μm (solid black) and 4–5 μm (solid blue) are visible. After sonication, the microbubbles were reanalyzed (dashed), depicting little deviation of its mean or median diameters.