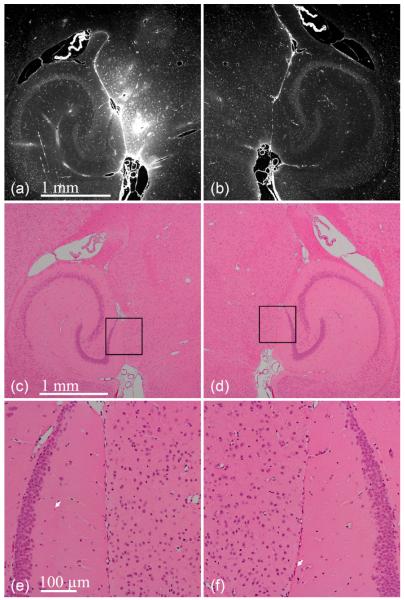
Fig. 8.
Paraffin-embedded 6-μm thick brain sections after sonicating the (a, c, and e) left ROI at 0.46 MPa in the presence of 1–2 μm bubbles. The (b, d, and f) right was the control. Increased fluorescence in the (a) left ROI indicates delivery of 3 kDa dextran. Hematoxylin and eosin sections reveal no macroscopic damage. White arrows indicate erythrocytes, but may be artifacts due to histological techniques since they were observed on both hemispheres. The black boxes in (c) and (d) refer to the ROIs of (e) and (f).

