
Figure 3.
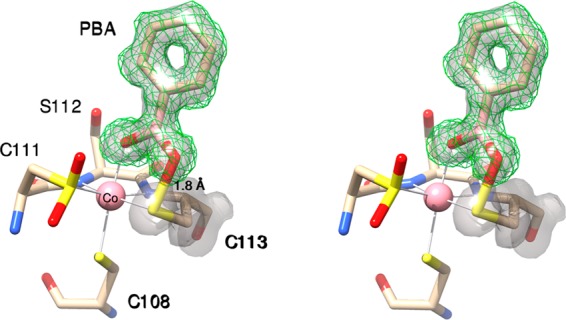
Stereoview of PtNHase bound by PBA at 1.2 Å resolution obtained via cocrystallization of WT PtNHase and 10 mM PBA. The 2fo – fc map of the structural model representing 80% occupancy is shown as a transparent gray surface at the 1.4 σ level around PBA and αCys113. The simulated-annealing omit map (fo – fc) is shown around PBA as a green mesh at 2.8 σ.