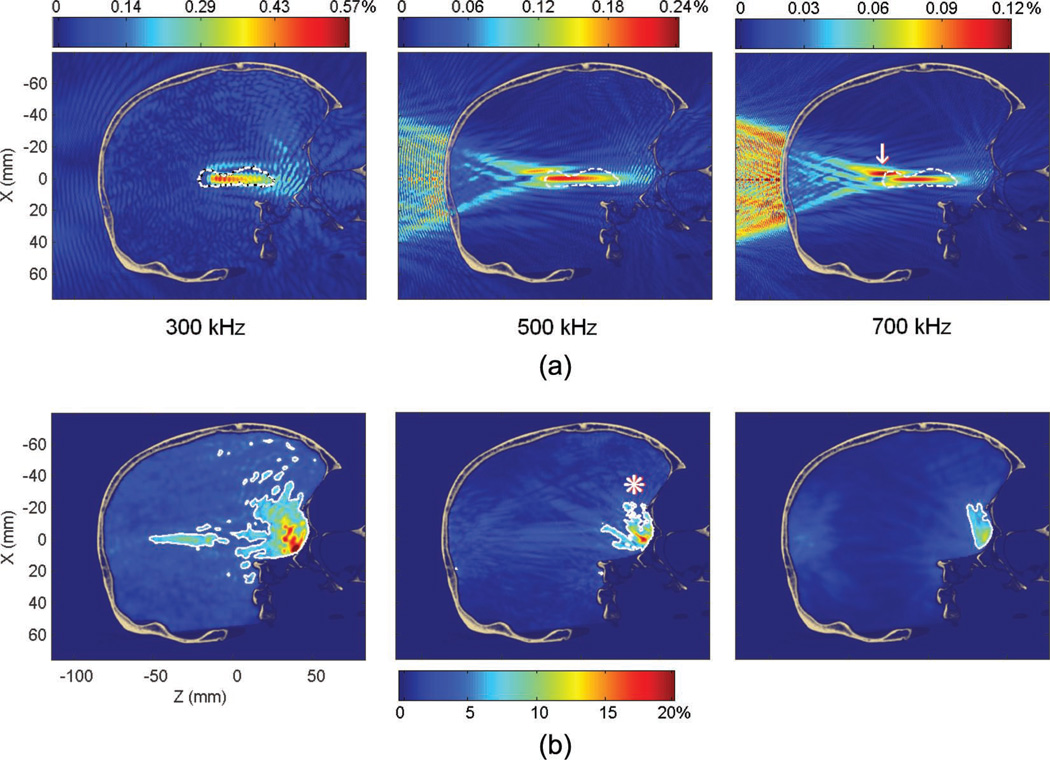
Fig. 7.
(a) Pressure fields at 300, 500, and 700 kHz (in percent of the peak pressure in water for the same frequency). The dashed line denotes the contour of the hippocampus. The white arrow indicates the secondary peak at the 700 kHz frequency. (b) Standing wave amplitude (in percent of the peak pressure through the skull at a given frequency). The white contour denotes the volume where the modulation amplitude is higher than 5% of the peak pressure through the skull. This volume decreases with the frequency from 3.7% (at 300 kHz) to 0.23% (at 700 kHz) of the brain volume. The white asterisk indicates the primary brain-skull interface where most of the standing wave effects are concentrated.

