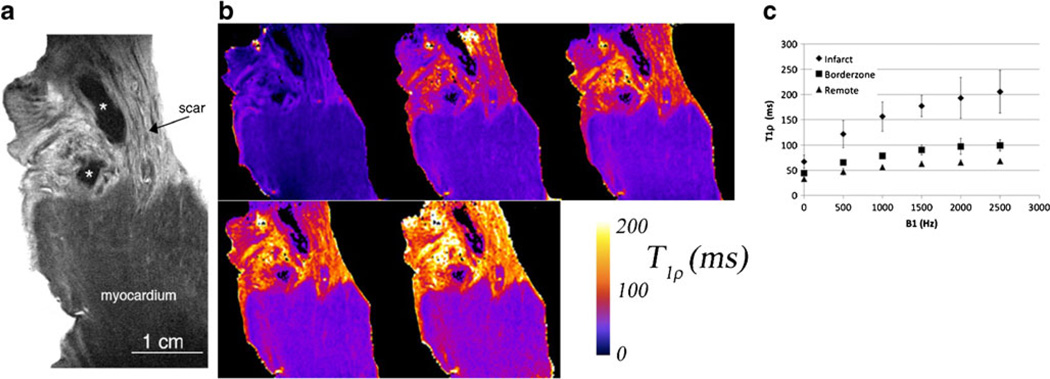
Fig. 2.
High resolution T1ρ MRI of ex vivo heart tissue from a pig 8 weeks post-infarction. The resolution is 50 µm × 50 µm × 1 mm. (a) Myocardium has lower T1ρ signal intensity (dark gray) compared to fibrotic tissue (light gray). * indicates a possible residual blood clot from dissection and may appear black because of strong magnetic susceptibility gradients from iron and hemoglobin, greatly reducing T1ρ signal intensity. (b) T1ρ parametric maps at five different spin lock amplitudes B1 = 0, 500 Hz, 1, 1.5, and 2.5 kHz. Note that B1 = 0 is a T2 map obtained using a spin echo sequence with a single refocusing RF pulse. (c) T1ρ relaxation times in infarcted, borderzone and remote myocardial tissue (n = 5). The variation in T1ρ relaxation times at different spin lock amplitudes is the T1ρ dispersion. Improved contrast-to-noise ratio at higher spin lock amplitudes is a consequence of increased ΔT1ρ between infarcted and normal myocardium

