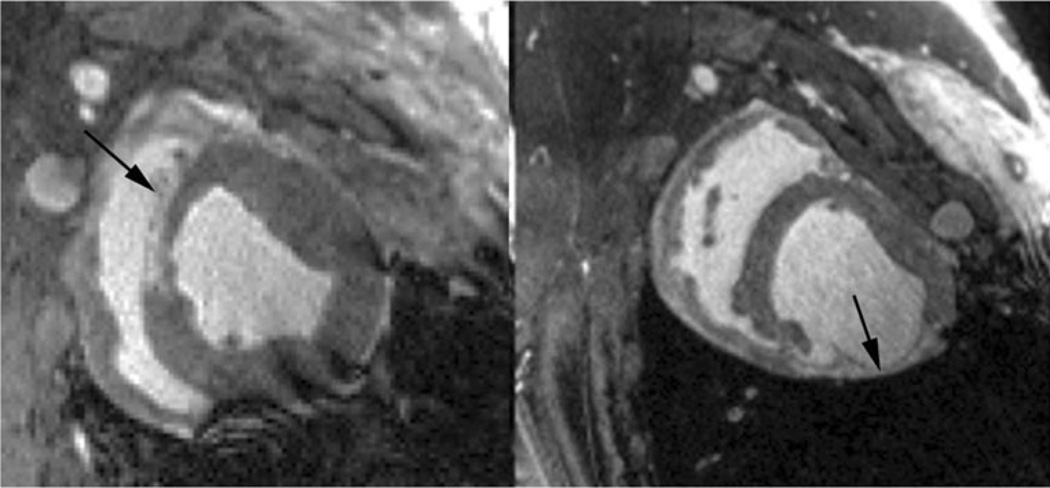
Fig. 6.
T1ρ MRI images in two pigs at 8 weeks post-myocardial infarction. The first image (left) was from a pig with LAD artery ligation and depicts hyperintense T1ρ signal at the area of infarction. The second image (right) was from another pig with circumflex artery ligation and shows both wall thinning associated with chronic infarction as well as hyperintense T1ρ signal at the area of infarction

