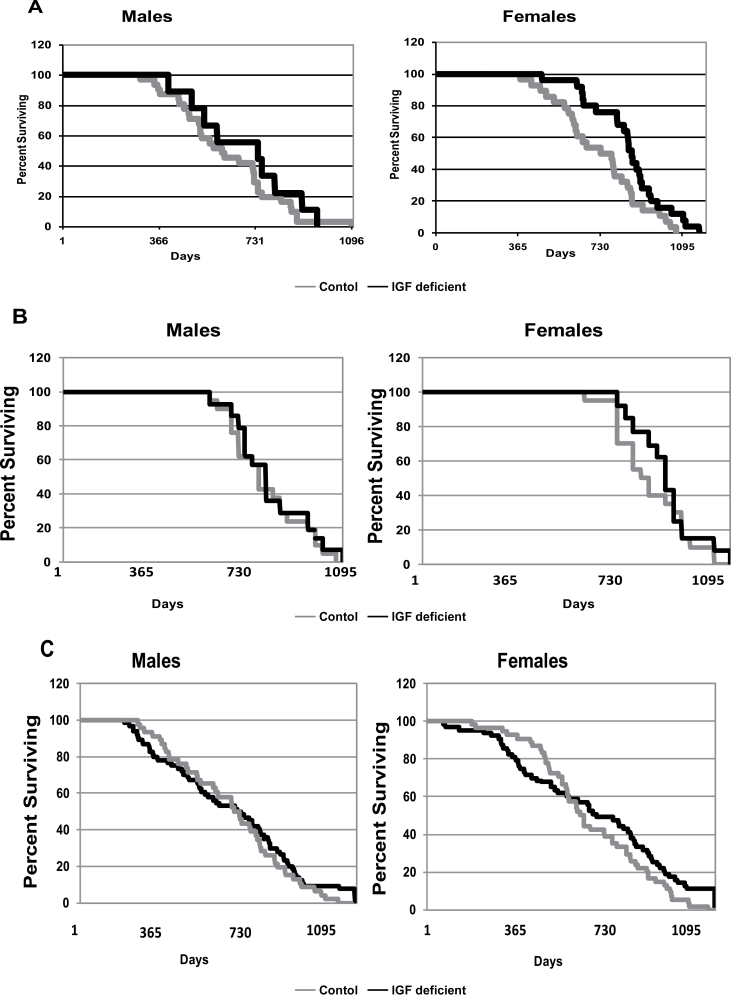
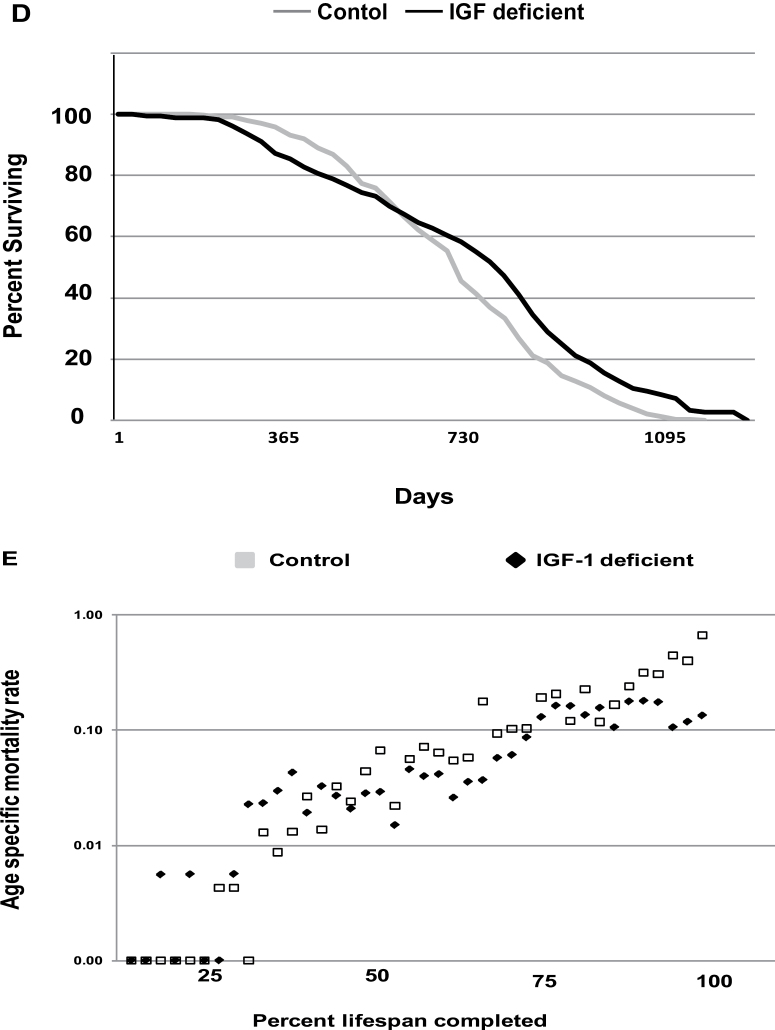
Figure 1.
Survival characteristics of IGF-1-deficient mice evaluated at three independent sites. Survival curves for life-span cohorts are presented from the three independent life-span analyses carried out as described in Materials and Methods. Panel A contains the survival curves for the life-span study carried out at the Lankenau Institute for Medical Research. Panel B contains the survival curve for the life-span study carried out at the Pennsylvania State University. Panel C contains the survival curve for the life-span study carried out at the University of Texas Health Sciences Center and San Antonio. Panel D contains a composite survival curve for all animals included in all three life-span studies. In Panel E, the age-specific mortality rates based upon the life table for Panel D were determined using 30-day increments throughout the life span.


