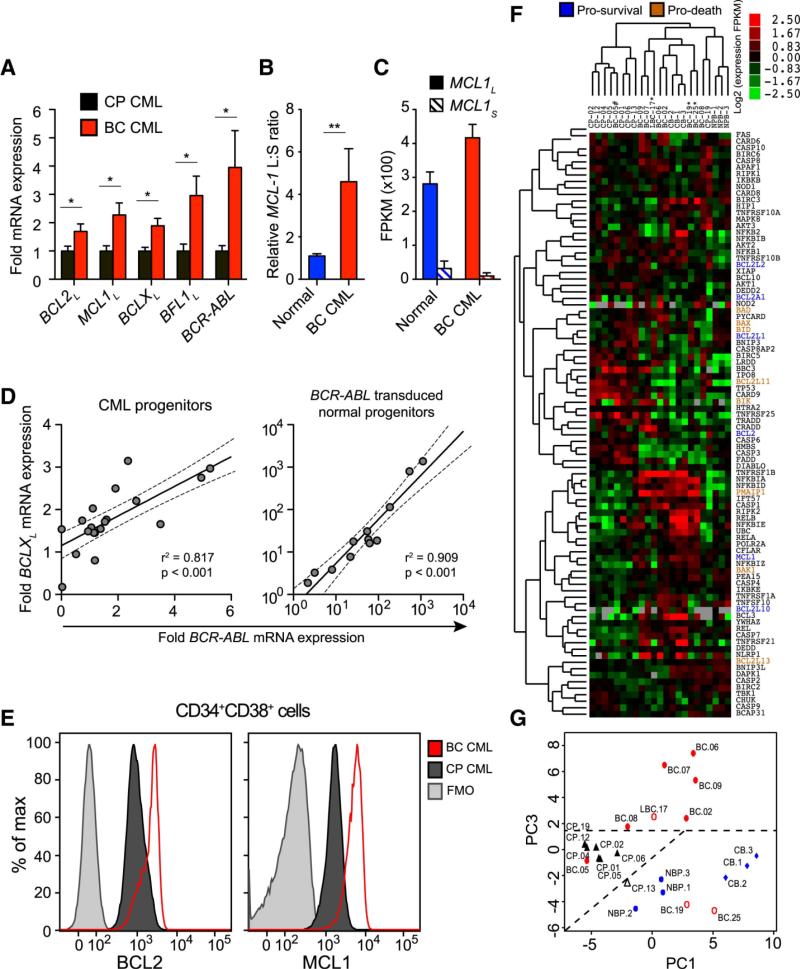
Figure 1.
see also Figure S1 and Table S1 and S2
a) qRT-PCR of pro-survival (long isoforms) BCL2, MCL1, BCLX, BFL1 and BCR-ABL mRNAs in primary CP (black, n=13) and BC (red, n=11) progenitors. Values are normalized to human HPRT mRNA expression. Graphs show mean +/− SEM; * p<0.05 by unpaired t-test. b) Relative ratio of MCL1 long to short isoforms in normal (n=7) and BC (n=8) progenitors. Graph shows mean +/− SEM; ** p<0.01 by unpaired t-test. c) Whole transcriptome sequencing of FACS-sorted progenitor cells from a normal and a BC sample showing quantification of MCL1L and MCL1S isoforms in each sample. Graph shows fragments per kilobase of exon per million fragments mapped (FPKM) +/− 95% confidence interval. Graphs show mean +/− SEM d) Correlation between BCR-ABL mRNA expression and BCLXL mRNA expression in progenitors. Left: Primary CP and BC samples (n=20). Right: BCR-ABL transduced normal progenitor colonies (n=12). Both graphs depict best-fit line and 95% confidence intervals by Pearson correlation analysis. e) Representative FACS histograms of BCL2 and MCL1 protein expression in CP progenitors (black) versus BC progenitors (red). Fluorescence minus one (FMO) controls are shown in grey. f) Full transcriptome RNA sequencing analysis of survival-pathway genes in FACS-sorted (CD45+CD34+CD38+LIN−) progenitors from 3 normal cord blood (CB), 3 normal adult peripheral blood (NP), 8 CP, 1 lymphoid BC (LBC) and 8 BC samples. Heat map depicts log2 fold FPKM. BCL2 family genes are highlighted and their functions are indicated by blue (pro-survival) or orange (pro-death) coloring. g) Unsupervised principal component analyses of the survival pathway genes for FACS-sorted CD45+CD34+CD38+LIN− progenitors from 3 normal cord blood (CB), 3 normal adult peripheral blood (NP), 8 CP, 1 lymphoid BC (LBC) and 8 BC samples.

