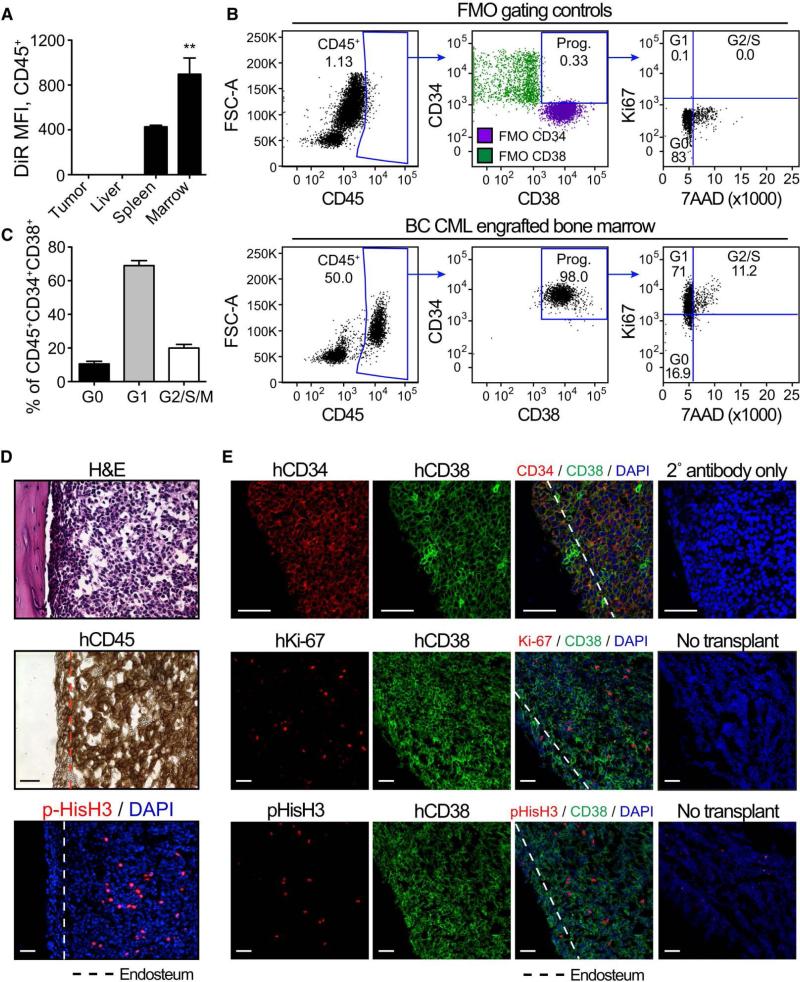
Figure 2.
see also Figure S2 and S3 and Table S3
a) Retained DiR fluorescence of BC progenitors (CD45+CD34+CD38+LIN−) engrafted in tumor (n=4), liver (n=4), spleen (n=3), and bone marrow (n=2) 18 weeks after DiR surface staining and transplant. Graph shows mean +/− SEM; *** p<0.001 by ANOVA and Tukey post-hoc analysis. b) Representative FACS plots showing gating and cell cycle analysis of live (PI−), bone marrow-engrafted BC progenitors (CD45+CD34+CD38+LIN−). FMO gating controls are shown in the top row, while engrafted bone marrow is shown in the bottom row. c) Quantification of BC progenitors in untreated marrow in the different phases of the cell cycle. N=10 engrafted bones. Graph shows mean +/− SEM. d-e) Histological analysis of engrafted bone marrow showing H&E, human CD34, CD38 and Ki67, and pHis-H3 staining. The dotted lines delineate the endosteum (~50μm from the bone edge). All scale bars equal 50μm.

