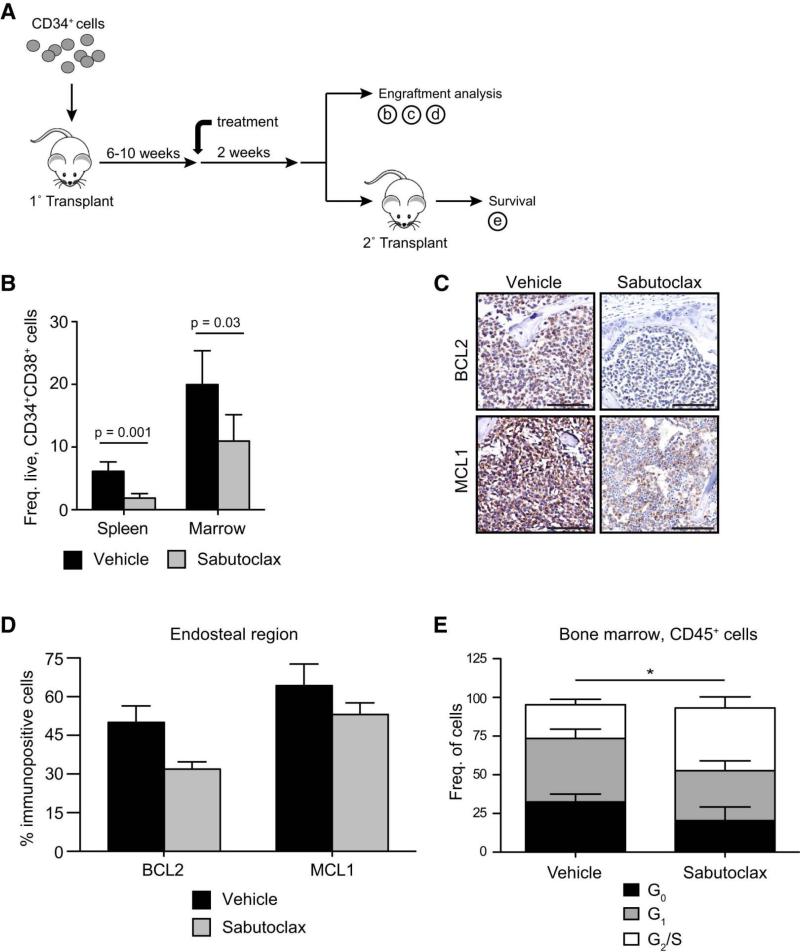
Figure 6.
see also Figure S7 and Table S6
a) In vivo experimental design used in the present studies. b) Engraftment of BC progenitors in spleen and bone marrow following vehicle (n=27) and sabutoclax treatment (5mg/kg, n=26). Graph shows mean +/− SEM for 3 different BC patient samples and statistical analysis by Mann-Whitney test. c) Representative immunohistochemical analysis of BCL2 and MCL1 staining in engrafted bone marrow following vehicle and sabutoclax treatment. Scale bars equal 100μm. d) Quantification of BCL2+ and MCL1+ cells in the endosteum of engrafted bone marrow following vehicle (n=3) and sabutoclax (n=3) treatment. Graph shows mean +/− SEM. e) FACS-cell cycle analysis of CD45+ bone marrow engrafted BC cells in vehicle (n=6) and sabutoclax (n=5) treated mice. Graph shows mean +/− SEM. *p<0.05 by unpaired t-test.

