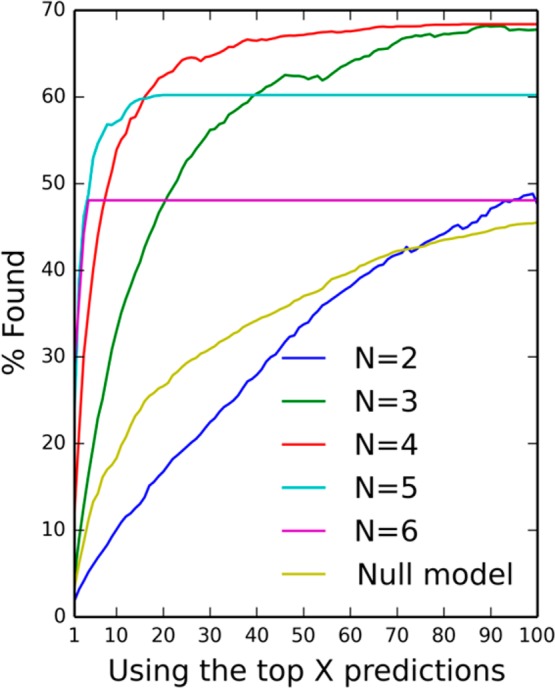
Figure 7.

Effect on performance of searching for the reference R group in the top X predictions, where X is from 1 to 100. The “null model” uses the most common substituents. The curve for N = 6 levels off at X = 4 as the reference R group (if present) never appears beyond the top 4; similarly the N = 5 curve levels off at X=20 and N = 4 at 84.
