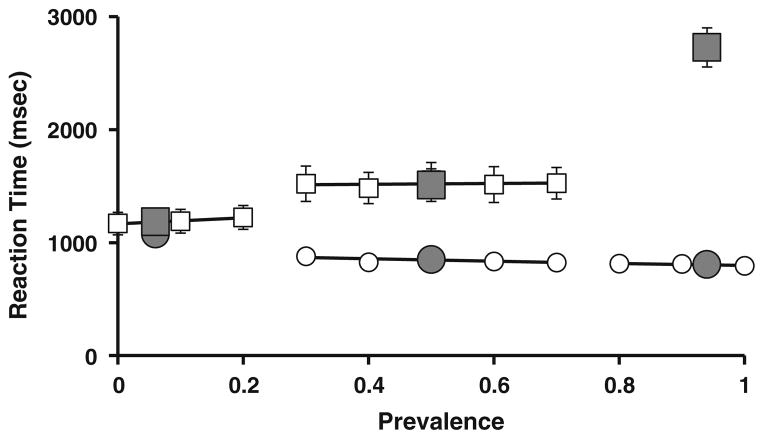
Fig. 4.
Reaction time (RT) spreads as a function of global and local prevalence in Experiment 1. Large symbols reproduce the RT data from Fig. 2; the squares are target-absent trials, the circles target-present trials. Smaller figures and regression lines show RTs as a function of local prevalence. Data are plotted only for those conditions producing at least 150 trials across 15 observers. Error bars represent ±1 SEM

