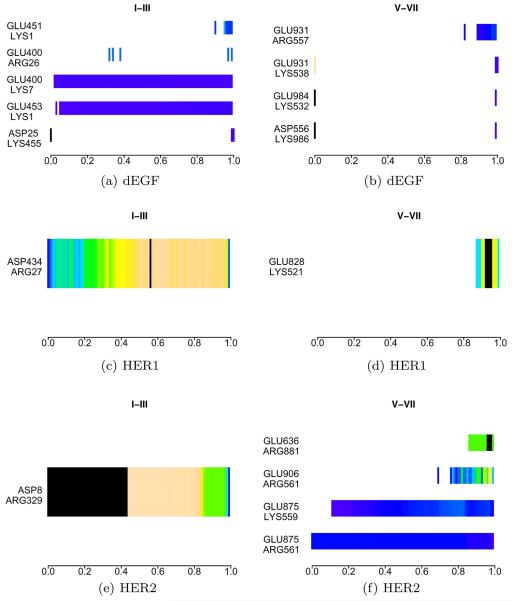
Figure 9.
Salt-bridges probability density along the asymmetric transitions. Domains I–IV represent the left domain, domains V–VIII represent the domains on the right. [Color figure can be viewed in the online issue, which is available at wileyonlinelibrary.com.]

