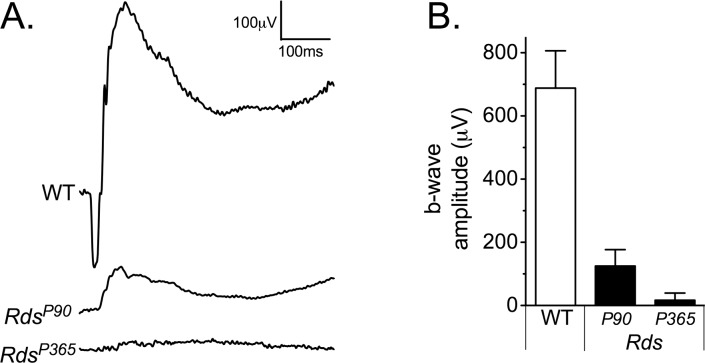
Figure 2.
Electroretinogram measurement of gross retinal function. (A) Representative electroretinogram waveforms are shown for wild-type, RdsP90, and RdsP365 mice. (B) Mean and standard deviation of the b-wave amplitude to a dark-adapted bright flash or “combined maximal response” stimulus is shown for groups of animals.

