
FIGURE 2.
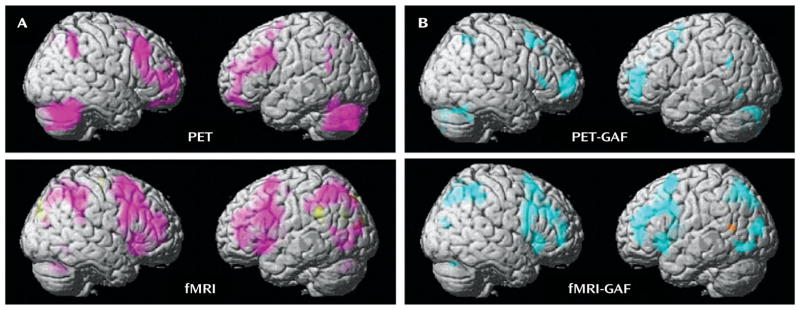
Between-Group Differences of PET and fMRI Activation in a Multimodal Neuroimaging Study of Premenstrual Dysphoric Disordera
a Panel A shows the between-group differences in activation (2-back > 0-back) using PET and fMRI. Regions in which patients had greater activation than comparison subjects are shown in pink. Panel B shows the correlations between Global Assessment of Functioning Scale (GAF) scores and activation in patients using PET and fMRI. Regions in which these two measures were negatively correlated (the greater the overactivation, the more severe impairment indicated by GAF scores) are shown in blue. For all analyses: p<0.05, false discovery rate corrected; extent threshold=50.