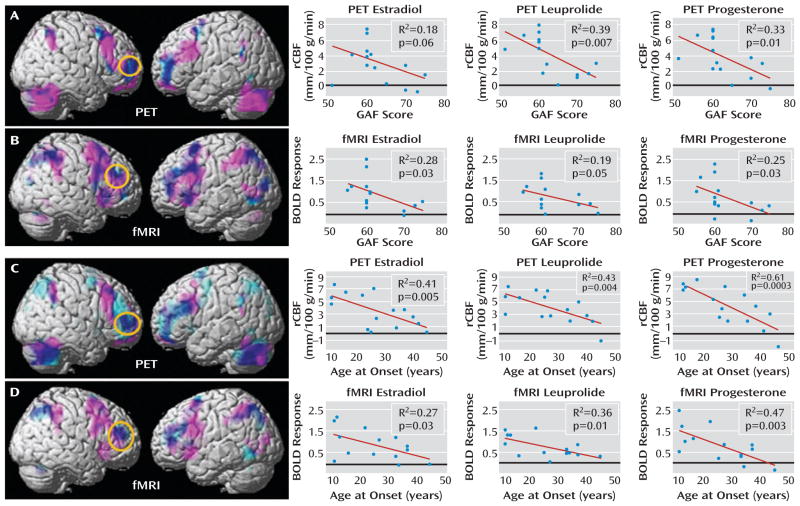
FIGURE 3.
Convergence of PET and fMRI Activation, Hormone Condition, Age, and Functioning in a Multimodal Neuroimaging Study of Premenstrual Dysphoric Disordera
a In the top panels, PET and fMRI scan overlays illustrate the convergence between regions in which patients showed overactivation (pink) and regions in which their activations correlated with their Global Assessment of Functioning Scale (GAF) scores (light blue); overlap is indicated in dark blue; p<0.05, false discovery rate corrected, extent threshold=50. The graphs on the right depict data for each individual by hormonal condition for PET (panel A) average rCBF from a 4-mm sphere centered at coordinates x=36, y=54, and z=4 and for fMRI (panel B) average BOLD signal from a 4-mm sphere centered at coordinates x=44, y=42, and z=28. Circles enclose the maximal voxel in activation-GAF score correlation maps within the dorsolateral prefrontal cortex mask, from which extracted values are plotted for each hormone condition separately. In the bottom panels, PET and fMRI scan overlays illustrate the convergence between regions in which patients showed overactivation (pink) and regions in which their activations correlated with their age at onset (light blue); overlap is indicated in dark blue; p<0.05, false discovery rate corrected, extent threshold=50. The graphs on the right show data for each individual by hormonal condition for PET (panel C) average rCBF from a 4-mm sphere centered on coordinates x=48, y=40, and z=20 and for fMRI (panel D) average BOLD signal from a 4-mm sphere centered on coordinates x=46, y=42, and z=24. Circles enclose the maximal voxel in activation-age at onset correlation maps within the dorsolateral prefrontal cortex mask, from which extracted values are plotted for each hormone condition separately.

