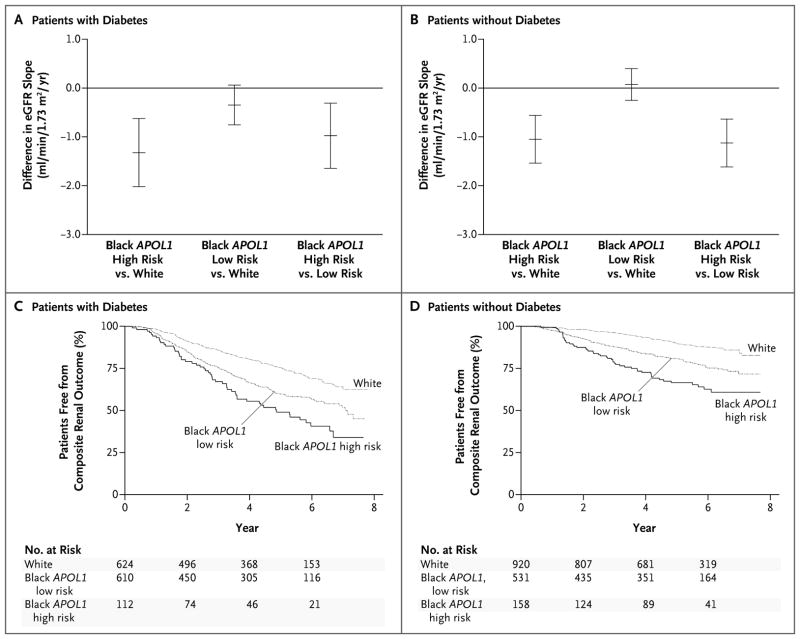
Figure 2. Between-Group Comparisons of the Estimated Glomerular Filtration Rate (eGFR) Slope and Proportion of Patients Free from a Primary Outcome Event in the CRIC Study.
In the Chronic Renal Insufficiency Cohort (CRIC) study, the primary outcomes were the eGFR slope and a composite of end-stage renal disease or a reduction of 50% in the eGFR from baseline. Shown are mean differences in the eGFR slope for black patients in the APOL1 high-risk group versus white patients, black patients in the APOL1 low-risk group versus white patients, and black patients in the APOL1 high-risk group versus black patients in the APOL1 low-risk group, among patients with diabetes (Panel A) and among those without diabetes (Panel B). In Panels A and B, the I bars indicate 95% confidence intervals. I bars that cross above the horizontal black line indicate that the difference in eGFR is not significant. Also shown are the proportions of white patients and black patients in the APOL1 high-risk and low-risk groups who were free from the primary outcome of end-stage renal disease or a reduction of 50% in the eGFR from baseline, among patients with diabetes (Panel C) and among those without diabetes (Panel D).

