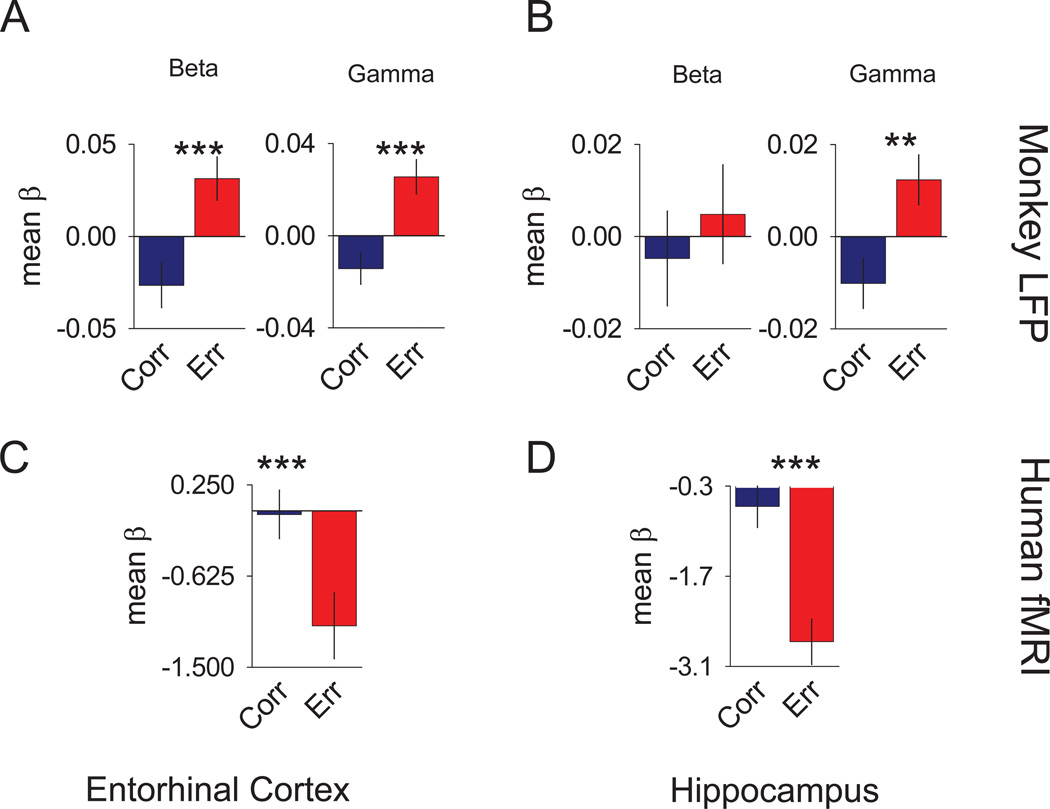
Figure 4. Trial Outcome signals of the monkey LFP and human fMRI.
Individual bar graphs depict the comparisons between mean correct (blue) versus mean error (red) trials (± SEM of the differences). (A) Results for the monkey entorhinal LFP signal multiple regression analyses comparing the mean β values . (B) Results for the monkey hippocampal LFP signal multiple regression analyses comparing the mean β values (C) Results of the human entorhinal fMRI BOLD signal multiple regression analyses comparing the mean β values. (D) Results of the human hippocampal fMRI BOLD signal multiple regression analyses comparing the mean β values. *** = p <0.005. See also Figure S2–6.

