Fig. 1.

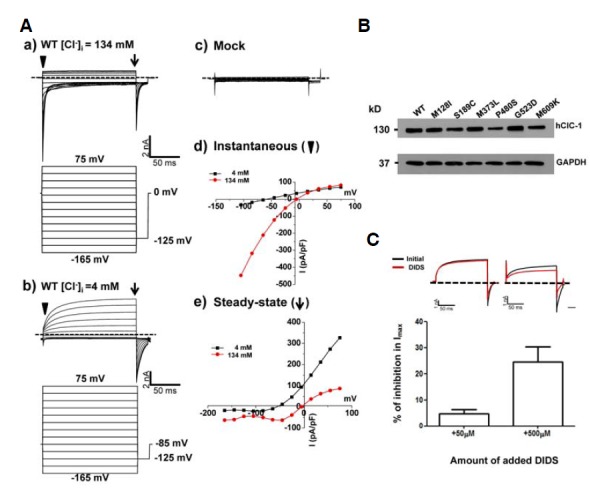
Channel characteristics and expression of WT hClC-1 in HEK293 cells. (A) a) Representative whole cell current traces for WT hClC-1 and voltage protocol for hClC-1 channel activity under 134 mM [Cl−]i in HEK293 cell expressing hClC-1. For voltage protocol, each holding potential and tail pulse was fixed at 0 mV and −125 mV. A series of voltage step pulses was applied from −165 mV to +75 mV in 20 mV steps for WT or mock transfection test. b) Representative whole cell current traces for WT hClC-1 and voltage protocol for hClC-1 channel activity under 4 mM [Cl−]i in HEK293 cell expressing hClC-1. For voltage protocol, each holding potential and tail pulse was fixed at −85 mV and −125 mV. A series of voltage step pulses was applied from −165 mV to +75 mV in 20 mV steps. c) Mock transfection test in HEK 293 cells. pEGFP-N1 vector was transiently expressed in HEK293 cells and the same voltage pulses were applied as WT. d) The instantaneous currents (where an inverted triangle indicates) were measured under both 134 mM [Cl−]i and 4 mM [Cl−]i at the beginning of test voltage pulses, normalized with respect to cell capacitance (pA/pF). e) Steady-state currents (where an arrow indicates) were measured under both 134 mM [Cl−]i and 4 mM [Cl−]i at the end of test voltage pulses, normalized with respect to cell capacitance (pA/pF). Dashed lines indicate zero-current level. (B) Western blotting analysis of the protein expression of hClC-1 and mutants. 24 h after transfection the total cell lysates were examined. GAPDH was used as a loading control. (C) Inhibition of hClC-1 WT by extracellular application of 50 μM and 500 μM DIDS. hClC-1 was transiently expressed in HEK293 cells and representative whole cell current traces were elicited by the voltage protocol which applied at 75 mV under 4 mM [Cl−]i. Each holding potential and tail pulse was fixed at −85 mV and −125 mV. Dashed lines indicate zero current line (top). Currents were measured initially (black), after steady-state inhibition in 50 μM and 500 μM DIDS for 30 s (red). Reduced maximal currents obtained at 75 mV under 50 μM (n = 5) and 500 μM (n = 5) DIDS treatment compared to initial currents were indicated in the bar graph (bottom).
