
Fig. 8.
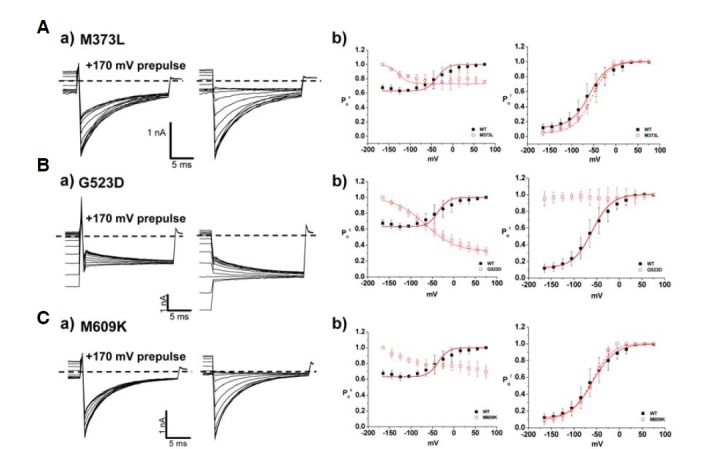
Analysis of fast and slow gating in sporadic mutants. (A–C) a) Characteristics of fast and slow gating in M373L (A), G523D (B), and M609K (C). Whole cell current traces with prepulse, 170 mV (left) at −125 mV were indicated. Dashed lines indicate zero current level. b) Comparison of slow gating channel activation curves (left) and fast gating channel activation curves (right) of WT and sporadic mutants. Black closed squares and red opened squares represent WT (n = 10) and mutants, M373L (n = 5), G523D (n = 10), M609K (n = 8), respectively. The averaged data were fit with a Boltzmann distribution, and V1/2 parameters are reported in Table 3.