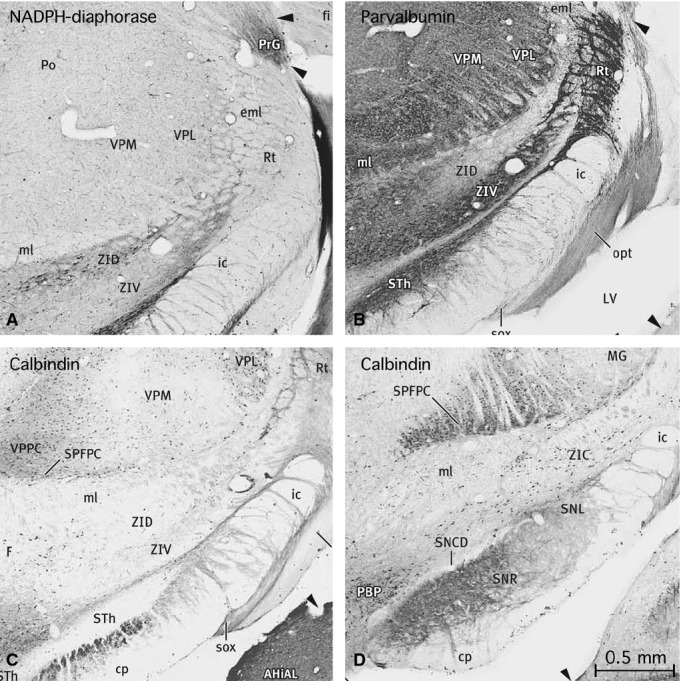
Figure 4.

Four images taken from a chemoarchitectonic atlas of the rat brain (Paxinos et al. 2009b). These four images show the distribution of selected markers in the central and caudal parts of the zona incerta. (A) An image taken from Figure 221 of the atlas showing the distribution of NADPH diaphorase in the central zona incerta. Note the population of the dorsal part (ZID). (B) Image taken from Figure 222 of the atlas showing the distribution of parvalbumin in the central zona incerta. Note the heavy labelling in the ventral tier (ZIV), and in the medial part of the dorsal tier (ZID). (C) Image taken from Figure 223 of the atlas showing the absence of calbindin in the dorsal and ventral tiers of the zona incerta at this level. (D) Image taken from Figure 237 of the atlas showing the distribution of calbindin in the caudal zona incerta. Note the distinctive population of calbindin-labelled cells in this area.
