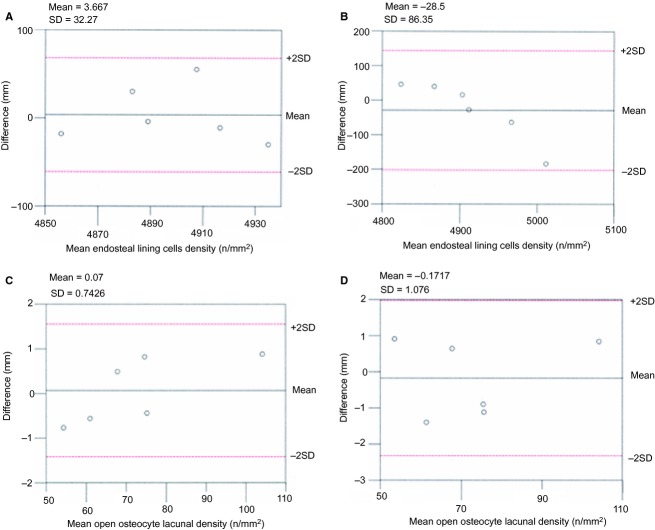
Figure 2.
Scatterplots showing: (A) mean of paired measurements (intraobserver) plotted against differences in the density assessment of lining cells; (B) mean of paired measurements (interobserver) plotted against differences in the density assessment of lining cells; (C) mean of paired measurements (intraobserver) plotted against differences in the density assessment of open osteocyte lacunae; (D) mean of paired measurements (interobserver) plotted against differences in the density assessment of open osteocyte lacunae.

